-01%201.svg)
Key takeaways
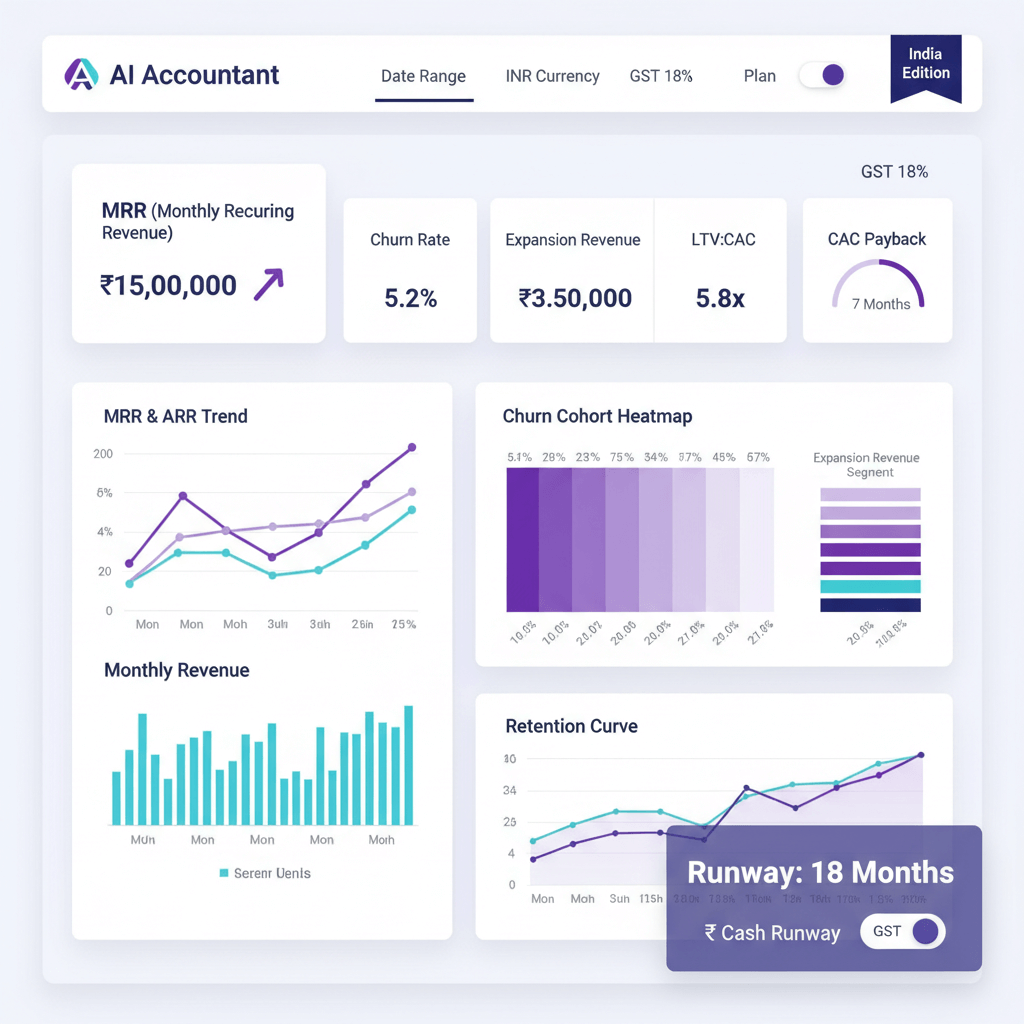
- A SaaS metrics dashboard for India must reflect local realities, including GST, UPI mandates, TDS, and gateway settlement delays, not just global templates.
- Separate booked, billed, recognized revenue, and cash, align your revenue recognition with Ind AS 115 for investor and audit readiness.
- Track churn by type, customer versus revenue, and isolate involuntary churn caused by payment failures, improving retention with targeted retries.
- Unit economics should be margin-aware, use the unit economics calculator India to compute LTV:CAC, payback, and segment profitability.
- Build data pipelines that reconcile billing, payments, and accounting, start with a robust mapping of customer IDs, use a data pipeline from books to dashboards for accuracy.
- Automate reconciliation and compliance, AI-driven tools like AI Accountant reduce month-end close time, improve trust in numbers.
- Visualize scenario-based runway, cohort retention, and expansion drivers, use no-frills layouts that leadership, finance, and sales can consume quickly.
Why Indian SaaS Companies Need Specialized Dashboards
Indian SaaS founders operate in a complex environment where GST, UPI, and settlement delays distort the apparent health of the business. A specialized dashboard ties together billing systems, payment gateways, and accounting ledgers to show true performance, not just headline MRR.
Consider an annual contract collected upfront in March. Your bank looks flush, but recognized revenue must follow Ind AS 115, spreading revenue across the service term. Meanwhile, you wait for input credits, handle TDS reductions, and reconcile T+2 to T+7 gateway settlements.
Dashboards that ignore India’s payment and tax context, overstate health, understate risk, and mislead planning.
For practical implementation examples and visualization patterns tailored to Indian teams, see the Sales analytics dashboard India, and compare GTM benchmarks in GTM metrics for AI SaaS India.
Core Metrics Every SaaS Dashboard Must Track
MRR and ARR Fundamentals
MRR versus ARR frames your revenue narrative. Normalize annual, quarterly, or irregular billings into MRR, then multiply by 12 for ARR. Keep distinct views for booked, billed, and recognized revenue, avoid mixing one-time fees into recurring streams.
Normalize for trials, credits, and refunds, especially where procurement delays extend trial periods. For deeper metric frameworks and templates, review the ultimate guide to SaaS dashboard metrics, the SaaS metrics dashboard template, ultimate 2025 guide, and SaaS analytics resources.
Understanding Churn Types and Calculations
Measure both customer churn and revenue churn, they tell different stories. Calculate NRR and GRR separately, track involuntary churn from payment failures to avoid misclassifying customers who still want the product.
Build cohort views by acquisition month or billing start date to see product-market fit changes over time. Reference cohort setups in the ultimate guide to SaaS dashboard metrics and the SaaS metrics dashboard template, ultimate 2025 guide.
Expansion Revenue and Growth Drivers
Segment upsells, cross-sells, and seat additions, distinguish real expansion from price increases. Link usage events to upgrade moments, then feed this into product prioritization. For templates, see the SaaS metrics dashboard template, ultimate 2025 guide.
LTV:CAC and Unit Economics
Use margin-aware LTV, compute LTV as ARPU times gross margin divided by churn rate. Include fully-loaded CAC, factor GST on ads, events, and vendor services. Segment by channel and customer type to avoid misleading blended averages, leverage the unit economics calculator India for consistent computation, and compare methodologies in SaaS KPI dashboard metrics, the SaaS metrics dashboard template, and GTM metrics for AI SaaS India.
Cash Runway and Burn Metrics
Compute runway using cash, receivables, and payables, then overlay Indian timing realities such as GST credits, TDS refunds, and settlement lags. Model base, growth, and conservative scenarios to present to boards with confidence. For examples, review the Sales analytics dashboard India.
Building Dashboard Architecture for Indian Context
Data Source Integration Challenges
Your SaaS KPI dashboard must reconcile CRM, billing, accounting, and payment gateways. Start by mapping customer IDs, then build a master table to prevent double counting. See a practical blueprint in the data pipeline from books to dashboards. For reference architectures and metric dictionaries, compare the ultimate guide to SaaS dashboard metrics, SaaS KPI dashboard metrics, and the Sales analytics dashboard India.
Normalize timestamps to IST, several platforms default to UTC or PST, which can break month-end reconciliation without careful alignment.
Handling Payment Gateway Complexities
Indian gateways impose fees and settlement delays that impact realized revenue and cash timing. Build robust reconciliation using transaction IDs, track fee rates by payment method, and separate failure reasons across UPI, cards, and net banking. Implement automated retries and report success rates to reduce involuntary churn.
GST and Tax Compliance Integration
Track GST-exclusive versus GST-inclusive amounts, manage input credits rigorously, and reconcile GSTR filings before deadlines. Pending input credits affect working capital, which should appear in runway models. See workflow examples in the Sales analytics dashboard India.
Dashboard Implementation: Tools and Techniques
Selecting the Right Technology Stack
Early-stage companies can begin with spreadsheets, growth-stage teams should invest in BI and ETL. Representative categories:
- Business Intelligence: AI Accountant for automated financial data extraction and GST reconciliation, Looker Studio, Power BI, Metabase, Tableau.
- Data Pipelines: Airbyte or Fivetran, Apache Airflow, dbt.
- SaaS Metrics: ChartMogul, Baremetrics, ProfitWell.
Start simple, then scale into proper pipelines and warehouses. For selection checklists and KPI mapping, review the ultimate guide to SaaS dashboard metrics, SaaS KPI dashboard metrics, and the SaaS metrics dashboard template.
Step-by-Step Dashboard Creation Process
- Step 1, Define core KPIs: MRR growth, NRR, CAC, gross margin, runway.
- Step 2, Map data sources: Create a data dictionary, assign ownership for each metric’s source.
- Step 3, Build data models: Cohorts, LTV tables, CAC attribution, margin decomposition.
- Step 4, Design layouts: Role-based views for leadership, finance, sales.
- Step 5, Validation checks: Reconcile dashboard numbers with billing and accounting.
- Step 6, Refresh cadences: Daily for finance, weekly for cohorts, monthly for unit economics.
Creating Visual Layouts That Work
Group tiles by growth, retention, unit economics, and financial health. Use consistent visual cues, keep dense views legible, and prioritize comparisons over decoration. For layout inspiration, see the ultimate guide to SaaS dashboard metrics and SaaS metrics dashboard.
Operational Excellence: Maintaining Dashboard Accuracy
Establishing Review Cadences and SOPs
Set daily, weekly, and monthly reviews with clear responsibility. Use anomaly detection for rapid alerts, then document escalation SOPs. For process examples and metric QA checklists, compare ultimate guide to SaaS dashboard metrics and SaaS KPI dashboard metrics.
- Daily: Cash and bank reconciliation, failed payment retries, MRR alerts, settlement tracking.
- Weekly: Cohort updates, pipeline coverage, collection efficiency, health scores.
- Monthly: Cohort refresh, LTV:CAC recalculation, board decks, variance analysis.
Common Pitfalls and How to Avoid Them
- Mistaking cash for revenue: Separate cash, billings, and recognized revenue.
- Ignoring settlement delays: Model DSO, include GST credits and TDS timing.
- Unsegmented averages: Segment by plan, customer type, and geography.
- Incomplete CAC attribution: Use fully-loaded CAC, include GST on vendor services.
For anti-patterns and templates that enforce best practice, see the SaaS metrics dashboard template, ultimate 2025 guide, and examples in the Sales analytics dashboard India.
India-Specific Dashboard Considerations
Managing Annual Contract Complexities
Annual prepayments demand accrual views, track deferred revenue and liabilities, and apply seasonal normalization for fiscal year-end and festival spikes. Monitor TCV versus ACV for multi-year deals, present both cash and accrual views to avoid misinterpretation.
UPI and Payment Method Optimization
Track success rates, mandate expiries, and failure reasons by method, then compute true cost after intervention effort. For patterns and GTM implications, compare the Sales analytics dashboard India and GTM metrics for AI SaaS India.
GST Reconciliation and Compliance Tracking
Build a GST dashboard for GSTR-2B reconciliation, export documentation, credit utilization, and deadline alerts. Working capital impact from credits should roll into runway scenarios to reflect real cash availability.
Leveraging AI for Dashboard Automation
How AI Accountant Streamlines Data Preparation
Manual extraction and matching consume most build time. AI Accountant ingests bank data, reconciles gateway settlements to bank credits, structures vendor invoices, and automates GST reconciliation, reducing close cycles and error rates. See practical flows in the Sales analytics dashboard India.
Building Predictive Capabilities
Use machine learning to forecast churn probabilities, expansion likelihood, and collection timing. Anomaly detection flags unusual spikes or dips, enabling timely intervention by customer success, finance, and product teams.
Real-World Implementation Case Study
Bengaluru AI-SaaS Success Story
A Bengaluru AI-SaaS company at 50 crore ARR migrated from manual spreadsheets to a robust dashboard, corrected NRR to exclude price increases, achieved margin-aware LTV:CAC, and extended runway by modeling receivables, payables, and settlement delays. AI Accountant automated reconciliation, cutting close time by 70%, letting finance shift from data entry to decision support.
For similar outcomes and board-ready views, review the Sales analytics dashboard India, and benchmark go-to-market trends with GTM metrics for AI SaaS India.
Conclusion and Next Steps
Indian SaaS dashboards must be grounded in local payment and tax realities, not just generic templates. Start with core metrics, implement reliable pipelines, and layer in validation and scenario modeling. Use automation to reclaim analyst time, so the team focuses on insight generation rather than manual reconciliation.
Adopt a phased approach, begin simple, then scale tooling as your customer base grows. If messy data is blocking progress, explore AI Accountant for bank statement cleaning, AP bill structuring, and GST reconciliation that underpin trustworthy metrics. Your dashboard becomes the single source of truth that aligns teams, impresses investors, and guides sustainable growth.
FAQ
How should a CA reconcile MRR with recognized revenue for Ind AS 115 compliance?
Maintain parallel views, MRR for operating cadence and forecasting, recognized revenue per service delivery under Ind AS 115. Reconcile monthly by contract, compare billing schedules to revenue schedules, and use an AI tool like AI Accountant to match invoices, collections, and journal entries, ensuring audit-ready trails.
What cohort granularity is advisable for a mid-market SaaS with annual billing patterns?
Monthly cohorts are preferred to capture seasonality, especially March surges at fiscal year-end. If volume is low, use quarterly cohorts for statistical stability, but preserve monthly overlays to spot procurement-driven anomalies. AI Accountant can generate cohort tables aligned to billing start dates for accurate retention analyses.
How do refunds and credit notes flow through MRR, GRR, and NRR?
Exclude refunds and credits from base MRR, record them as contraction events in the period processed. Update GRR and NRR accordingly, then adjust recognized revenue via credit notes compliant with GST rules. Use automation to flag credit notes that require return amendments, preventing input credit misstatements.
What variance tolerance should a CA set between billing data and accounting ledgers?
Keep variance under 2% for monthly reconciliation. Investigate timing differences, manual adjustments, and forex conversion impacts. Build transaction-level matching using invoice IDs, age unreconciled items, and deploy alerting when variances exceed thresholds, with AI Accountant assisting in matching gateway settlements to bank credits.
How can a CA compute margin-aware LTV:CAC and payback reliably?
Compute LTV as ARPU times gross margin divided by churn, calculate fully-loaded CAC including sales salaries, tools, travel, and GST on vendor services. Segment by channel and tier, then compute payback as CAC divided by ARPU times margin. Use the unit economics calculator India for consistent, audit-friendly calculations.
What is the correct approach to deferred revenue tracking for annual prepayments?
Create a deferred revenue ledger per contract, recognize revenue evenly or usage-based per the performance obligation. Show both cash and accrual views on the dashboard, age deferred revenue balances, and tie recognition schedules back to contracts. AI Accountant can sync these schedules with Zoho Books or Tally for clean financials.
How should involuntary churn from UPI mandates be segmented and managed?
Segment failures by reason, insufficient balance, expired mandates, technical errors, and customer-initiated blocks. Track first-attempt success rates and retry outcomes, trigger reauthorization campaigns ahead of expiries, and quantify recovery rates. Present these as separate involuntary churn metrics so core product churn is not overstated.
What runway presentation do boards expect for Indian SaaS with settlement and GST delays?
Provide base, growth, and conservative scenarios, incorporate receivables timing, settlement lags, pending GST credits, and TDS refunds. Show gross versus net burn, then overlay DSO by payment method. Automate inputs with AI Accountant to maintain daily accuracy without manual spreadsheet updates.
How can a CA ensure GST reconciliation is embedded in the dashboard workflow?
Implement a GST module that tracks GSTR-2B matching, export documentation, credit utilization, and filing deadlines with statuses. Flag mismatches and credit notes requiring amendments, push summaries to finance dashboards, and link to working capital and runway calculations to reflect real cash availability.
What SOPs should a CA define for metric validation and anomaly detection?
Document responsibility by metric owner, define reconciliation checks against source systems, set alert thresholds for unusual changes, and create escalation paths. For example, trigger alerts when daily MRR deviates beyond three standard deviations or collection rates fall below 85%. AI Accountant can power these checks by syncing bank, gateway, and ledger data.
How should enterprise and SMB segments be compared for CAC payback and NRR?
Maintain separate dashboards for segments, compute CAC, LTV, margin, and payback per segment, and break out NRR drivers like expansion versus contraction. Enterprise may show higher CAC with stronger expansion-led payback, SMB may require tighter DSO management. Segment-level reporting prevents blended averages from masking risk.
What is the recommended approach to currency and timezone normalization for cross-border contracts?
Standardize reporting currency, apply daily FX rates for recognition and comparison, and normalize timestamps to IST for consistency in Indian filings. Build transformation logic in the pipeline, then validate totals against source systems. Automated pipelines, supported by AI Accountant, minimize manual discrepancies and audit friction.

Rohan Sinha is a fintech and growth leader building aiaccountant.com, focused on simplifying accounting and compliance for Indian businesses through automation. An IIT BHU alumnus, he brings hands-on experience across 0 to 1 product building, growth, and strategy in B2B SaaS and fintech.