-01%201.svg)
Key takeaways
- A sales analytics dashboard for India must reflect GST, April to March fiscal cycles, distributor complexity, and festival seasonality, otherwise your numbers will mislead decision making.
- Focus on four pillars, pipeline health, conversion flow, forecast realism, and territory performance, each with clear definitions and drill downs.
- Blend CRM booking data with accounting collections to move from optimistic revenue to cash grounded forecasts, a practice finance leadership will trust.
- Start simple, five to seven KPIs, iterate weekly, document calculations, and embed review rituals so insights translate into action.
- Tools matter, AI Accountant strengthens cash visibility and GST reconciliation, while platforms like Power BI or Zoho Analytics deliver robust visualization.
Table of contents
Sales Analytics Dashboard India, Your Complete Guide to Smarter Sales Tracking
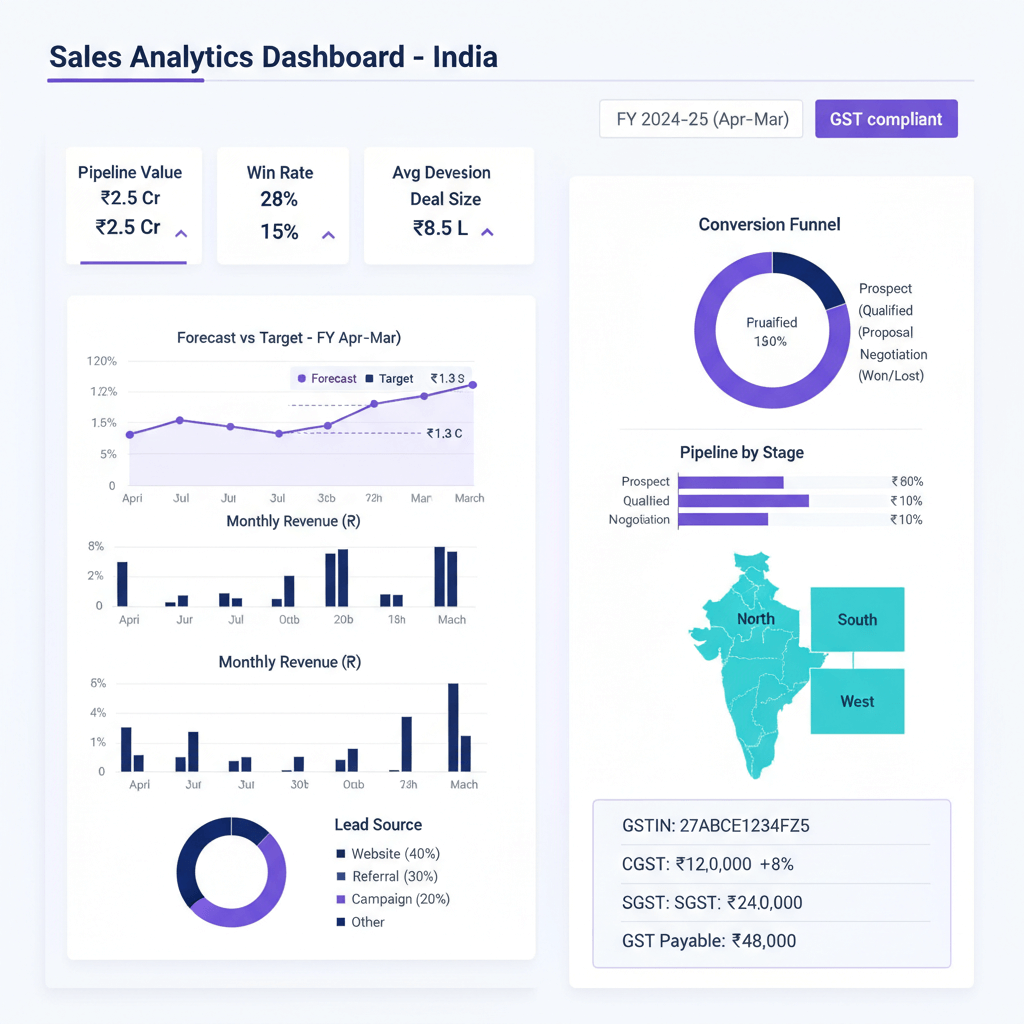
A sales analytics dashboard India is your control room, it surfaces pipeline health, conversion blockers, territory performance, and realistic forecasts. For Indian businesses, the dashboard must handle GST compliance, April to March fiscal years, distributor chains, and seasonality. Most SMEs already run Zoho CRM, Zoho Books, or Tally, the challenge is not data collection, the challenge is interpretation and action.
You need quick visibility across four areas, pipeline volume and velocity, conversion paths and drop offs, forecast confidence and cash collections, territory strengths and efficiency. What follows is a practical blueprint to build a dashboard that works in Indian conditions, no fluff, just steps you can implement.
Understanding Core Components of Sales Analytics Dashboard India
Sales Pipeline Tracking Fundamentals
Your pipeline flows through typical stages, Marketing Qualified Lead, Sales Qualified Lead, Proposal, Negotiation, Won or Lost. Track five essentials, pipeline value, coverage ratio versus targets, average deal size, stage velocity in days, and aging buckets for stuck deals.
- Visualize with funnels for overall flow, monthly cohorts for progression, heatmaps for stage aging to spot bottlenecks.
- Account for Indian realities, longer approval cycles, distributor multi step sales, government tender processes.
Conversion Rate Metrics That Matter
Conversion rates reveal process health. Calculate stage to stage percentages, for example, if 100 SQLs produce 40 proposals, that is 40 percent. Segment win rates by lead source, product, territory, and sales rep to isolate what works.
- Track time to convert and acquisition cost by channel.
- Use waterfall charts to show conversion flow, or Sankey diagrams to map sources to outcomes, both highlight drop offs.
- Fix common pitfalls with consistent stage definitions and minimum sample sizes, backed by governance and periodic audits.
Sales Forecast Dashboard Essentials
Forecasting is data driven, not guessing. Start with a weighted pipeline, multiply deal value by stage probability, then overlay historical patterns, festival spikes, quarter end rushes, and sales rep commitments. Measure accuracy with MAPE, track bias, and monitor attainment monthly.
- Link forecasts to cash, expected collections matter more than bookings, incorporate receivables risk and DSO.
- Visualize forecast versus actual lines, funnel bridges for movement, and risk bands for confidence ranges.
Territory Performance Analysis
Define territories clearly, states, zones, metros, and tier 2 cities, then keep rules consistent. Track revenue growth, quota attainment, average deal size, margin, and DSO per territory.
- Use India map heatmaps, league tables, and trend charts for clarity.
- Drive action, redeploy reps to high potential areas, adjust regional pricing, and tailor promotions.
Data Sources and Integration Strategies
Connecting Your Tech Stack
CRM systems hold pipeline and deal data, Zoho CRM, HubSpot, Salesforce. Accounting systems ground reality, Zoho Books and Tally provide invoices, payments, and receivables. Marketing data adds attribution, support systems show churn.
Master data alignment is critical, unique IDs for products, customers, and territories, plus careful handling of distributor hierarchies.
Ensure clean sync through data pipeline, from books to dashboards, and maintain ISO 27001 and SOC 2 compliance for security.
Building Your Integration Map
Map flows clearly, CRM stages feed opportunities, accounting invoices confirm revenue, GST credit notes adjust net, then build a single source of truth, define system ownership of each field, and set sync schedules.
Handle Indian specifics, multi entity structures, distributor hierarchies, and accurate GST fields with reconciliations and validations.
Designing Your Sales Analytics Dashboard India
Layout and User Experience
Place critical KPIs at the top, pipeline value, conversion rate, forecast accuracy, territory performance. Allow drill downs by segment, territory, and rep, and provide daily, weekly, and monthly time filters. Create role based views for leadership, sales, and finance.
Visual Best Practices for Indian Context
Use colors meaningfully, green for growth, red for attention, avoid clutter. Match chart types to the question, funnels for pipeline, lines for trends, maps for territories, tables for detail. Respect left to right reading patterns, group related metrics, and add benchmarks, prior year, targets, industry norms.
Implementation Roadmap
Phase 1, Foundation Setting
Define decision questions and KPIs, model sales stages, map territory boundaries, document conversion rules, and select the stack, Excel to start, Power BI or Tableau for scale, CRM native dashboards for convenience.
Phase 2, Data Preparation
Connect CRM and accounting via ETL, validate master data, deduplicate customers, verify GST fields. Standardize dates and currency, handle tax calculations correctly, and build initial visuals for pilot testing.
Phase 3, Rollout and Optimization
Launch with training, build SOPs, set refresh schedules and SLAs. Monitor usage, learn which reports matter, simplify complex views, and automate manual steps. Iterate every sprint with user feedback.
India Specific Considerations
GST and Compliance Requirements
Handle GST adjustments correctly, credit notes impact net revenue, interstate rates differ. Track GST reconciliation status, flag mismatches, and maintain compliance metrics per state.
Fiscal Year and Seasonal Patterns
April to March fiscal year shapes targets and reviews, festival seasons like Diwali and Dussehra spike demand, month end and quarter end pushes are common, your dashboard should show pressure and trends.
Multi Channel Complexity
Distributor networks require attribution rules, separate direct, channel, and online views, rural and urban patterns differ, and B2B versus B2C dynamics require tailored tracking, including government tenders.
Recommended Tools for Sales Analytics Dashboard India
Essential Software Options
- AI Accountant, syncs with Zoho Books and Tally, automates GST reconciliation, and links receivables tracking to sales forecasts.
- Zoho Analytics, native integration with Zoho CRM and Books, widely used by Indian businesses.
- Microsoft Power BI, powerful visuals with Excel connectivity for enterprises.
- Tableau, advanced analytics and strong data blending.
- Google Data Studio, free, good with Google Sheets and basic CRM data.
- QuickBooks Analytics, helpful if you use QuickBooks for accounting.
Tip, AI Accountant excels at cash focused insights, Zoho Analytics is seamless for Zoho stacks, Power BI suits enterprise scale needs.
For primers and playbooks, see Shopify sales dashboard, SME growth hacks with real time dashboards, Sales data analysis, Zendesk sales dashboard features, Data visualization and dashboards, and Data analytics for business.
Creating Your Metrics Catalog
Pipeline Health Indicators
- Pipeline value by stage and territory, coverage ratio monthly, aim for three times target coverage.
- Stage velocity benchmarks, for example, proposals averaging thirty days, flag exceptions.
- Aging buckets, forty five, ninety, one hundred eighty plus days, color coded risks.
- Average deal size by segment to improve forecast accuracy and resource planning.
Conversion Performance Metrics
- Stage conversions, SQL to Proposal, Proposal to Negotiation, Negotiation to Close, tracked consistently.
- Win rates by territory, product, source, and rep, each cut reveals specific actions.
- Time to convert and cost to convert, faster usually means lower costs and happier customers.
- Drop off reasons, price, competition, timing, product fit, captured systematically.
Forecast Accuracy Measurements
- MAPE, below ten percent is excellent, above twenty five percent needs rework.
- Bias detection, positive bias indicates over optimism, negative bias suggests sandbagging.
- Attainment rates versus commitments, consistent ninety percent plus signals reliability.
- Variance analysis by segment, learn where models perform well and where to refine.
Territory Efficiency Indicators
- Revenue and growth rate per territory, combined view for momentum and scale.
- Quota attainment, diagnose execution strength or target realism.
- Customer metrics, new logos, retention, average value, different territories have unique dynamics.
- Efficiency ratios, revenue per rep and deals per rep, compare to improve productivity.
Common Pitfalls and Solutions
Data Quality Challenges
Duplicates, inconsistent entry, and missing fields will undermine trust. Implement deduplication using GST numbers, standardize picklists, set mandatory fields, and run regular audits with data quality scorecards and alerts.
Process and Adoption Issues
Dashboards get ignored if not embedded in routines. Limit to core KPIs at start, include dashboard checks in daily huddles and weekly reviews, and add playbooks that link metrics to actions.
Technical Hurdles
Slow refresh frustrates users, optimize queries and use incremental loads. Monitor sync health, set alerts for failures, and clarify access with row level security for finance dashboards.
Measuring Dashboard Impact
Success Indicators
- Faster decisions, time from insight to action decreases.
- Improved forecast accuracy, MAPE trends down, bias narrows.
- Higher conversion rates, bottlenecks addressed faster.
- Increased engagement, more logins, report views, and drill downs.
ROI Calculation Framework
- Time savings on manual reporting, hours saved multiplied by cost.
- Revenue impact, better territory allocation and improved conversions.
- Cost avoidance, catching issues early reduces expensive fixes.
- Compliance benefits, fewer GST penalties, cleaner books.
Quick Implementation Checklist
Week 1 Tasks
- Define top five KPIs
- Map sales stages
- Identify data sources
- Document territory definitions
- List stakeholders
Week 2 Tasks
- Connect CRM to dashboard tool
- Link accounting system
- Clean customer master data
- Create initial visuals
- Test with pilot users
Week 3 Tasks
- Build forecast models
- Add territory analysis
- Create conversion funnels
- Set refresh schedules
- Document calculations
Week 4 Tasks
- Train end users
- Establish review cadence
- Create action playbooks
- Monitor adoption
- Plan iteration cycles
For collections linked forecasting, explore collections workflow automation in India, it helps connect receivables to forecast accuracy.
Next Steps for Your Sales Analytics Journey
Start with core metrics, then add sophistication, keep the dashboard tied to decisions and actions, not just charts. Connect CRM and accounting systems thoroughly, invest in data quality early, and train users so the dashboard becomes part of sales culture. Most importantly, measure outcomes, growth, efficiency, predictability, and iterate as your business evolves.
FAQ
How should a CA structure a sales analytics dashboard for an Indian SME running Zoho CRM and Tally, to ensure GST accuracy and cash grounded forecasts
Build a data model that maps CRM opportunities to accounting invoices and receipts, include GST fields, rate types, and credit notes. Use a weighted pipeline for near term forecasts, then reconcile with receivables aging and DSO. A practical approach is to connect Zoho CRM to a visualization layer, and use AI Accountant to sync Tally ledgers, GST reconciliations, and collections timelines, so forecast lines reflect cash collections instead of bookings.
What is the recommended method to calculate MAPE for sales forecasts, and how should it be presented in monthly management reports
MAPE is the mean absolute percentage error of forecast versus actual, compute by averaging the absolute error ratio across periods. Present monthly MAPE, a rolling three month MAPE, and a segment level MAPE for key products or territories. Include bias analysis, positive means optimism, negative means sandbagging, and show attainment rates to contextualize forecast reliability.
How do I reconcile booked orders in CRM with invoiced revenue in Tally, including GST adjustments and credit notes
Maintain two dates, booking date in CRM and invoice date in accounting. Create a mapping key per opportunity, then link invoices and credit notes. Net revenue equals invoices minus credit notes, and cash realization depends on receipts. Use receivables aging to adjust cash forecast, tools like AI Accountant can automate the reconciliation and produce clean schedules for review.
What coverage ratio should a CA recommend for pipeline versus target, and how do we validate its sufficiency during quarter end
Three times coverage is a common benchmark, adjust based on historical win rates and average deal size. Validate sufficiency by simulating outcomes, expected revenue equals pipeline value multiplied by weighted probabilities, then compare to target and attainment trends. If coverage dips below two times with a thirty percent win rate, the risk is high, trigger pipeline generation actions.
How can we attribute revenue to territories when distributors operate across state lines and split shipments
Define a primary attribution rule by customer state or ship to location, then record a secondary channel attribution for distributor performance. Maintain product level IDs so mixed shipments are correctly allocated. Provide dual views, territory performance on primary attribution, distributor performance on channel dashboards, and a combined portfolio view for management.
What governance controls should we implement for stage definitions and data hygiene, to improve conversion analytics quality
Publish a stage definition SOP, list mandatory fields, and enforce standardized picklists. Schedule weekly data hygiene checks and monthly audits, include duplicates, missing GST numbers, and invalid dates. Use AI Accountant or similar tools to automate data quality scorecards, then tie clean data to rep incentives for compliance.
How frequently should ETL jobs run for an SME, daily or near real time, considering load on Tally and CRM
For sales analytics, daily syncs are sufficient for most SMEs, with hourly syncs during quarter end or high velocity periods. Optimize with incremental loads rather than full pulls, and isolate heavy jobs outside business hours for Tally. Monitor sync health with alerts, and maintain a fallback manual refresh option for critical reviews.
What are best practices to integrate receivables aging into the sales forecast, to improve cash predictability
Split forecast into expected bookings and expected collections. Apply collection probabilities by aging bucket, for example, eighty percent for current, fifty percent for sixty plus, then produce a cash forecast line. Link account level risk flags, disputes, partial payments, and credit limits. AI Accountant can generate collection workflows and probabilities automatically.
How should we present territory performance in management packs, what metrics are essential for Indian multi state operations
Include revenue and growth rate, quota attainment, average deal size, margin, DSO, and customer metrics like new logos and retention. Provide league tables and trend lines per state or zone, and a product mix view to identify preferences. Add notes on regional price adjustments and distribution gaps to make the pack actionable.
What SOP should we enforce for sales reps to update pipeline stages, to keep velocity and conversion metrics trustworthy
Require stage updates within twenty four hours of meetings, enforce mandatory fields for Proposal and Negotiation, capture close reasons for Won and Lost, and audit stage aging weekly. Tie compliance to performance reviews, and highlight outliers in the dashboard. Short training modules and in app prompts improve adherence.
How does a CA validate forecast bias and address persistent over optimism from sales teams
Compute bias monthly and quarterly, then segment by rep and territory. If bias persists, adjust stage probabilities using historical conversion rates, and implement commitment tiers, base forecast, stretch, and commit, with accountability. Overlay a cash collection factor to counter optimism on bookings, a practice strengthened by receivables data from AI Accountant.
What visualization choices should we recommend for pipeline and conversion to reduce cognitive load for management
Use a simple funnel for pipeline stage volume, a waterfall for stage to stage conversion, and a Sankey for source to outcome mapping. Keep colors purposeful, label totals and conversion percentages clearly, and add benchmarks like prior year and target lines so context is visible at a glance.

Rohan Sinha is a fintech and growth leader building aiaccountant.com, focused on simplifying accounting and compliance for Indian businesses through automation. An IIT BHU alumnus, he brings hands-on experience across 0 to 1 product building, growth, and strategy in B2B SaaS and fintech.