-01%201.svg)
Key takeaways
- A data quality scorecard assigns a 0 to 100 trust score to your finance data across Tally, bank statements, and GST workflows, catching silent errors before they snowball into filing panics or reconciliation nightmares.
- Align with the RBI's Supervisory Data Quality Index (sDQI) dimensions: completeness, accuracy, timeliness, and consistency, giving your SMB or CA firm bank level reliability.
- Weight completeness and accuracy at 40% each, freshness at 15%, and exception counts at 5%, targeting a composite score of 95 or higher before posting to ledgers.
- Make ownership explicit using RACI roles with Time to Resolution SLAs. Without clear owners, exceptions linger and deadlines slip.
- Run a disciplined monthly review to spot trends, tighten thresholds, and fix process gaps early, not during filing week.
- When ingestion, classification, and reconciliation are manual, errors multiply. Automated bookkeeping platforms like AI Accountant handle repetitive data work so your team can focus on judgment calls and outcomes.
Data Quality Scorecards for Indian Finance Teams: What's New in 2026
Until mid 2025, most Indian SMBs treated data quality as a month end cleanup exercise. In 2026, three shifts have made that approach untenable.
First, the GST e-invoicing threshold dropped from ₹5 crore to ₹1 crore effective April 2025, pulling a significantly larger pool of SMEs into real time compliance. This means more transactions need accurate HSN codes, tax rates, and place of supply fields populated at the point of entry, not corrected later. Firms that still rely on batch corrections during filing week now face blocked uploads and interest on delayed filings under CBIC's updated e-invoicing framework.
Second, the RBI's sDQI methodology, originally designed for regulated financial institutions, has become a practical benchmark that auditors and CA firms reference when evaluating data governance. Completeness and accuracy are no longer aspirational. They are measurable, expected, and auditable.
Third, the Account Aggregator ecosystem now covers most major banks. Once AA feeds go live in your stack, freshness SLAs tighten from "upload weekly" to "sync daily." Firms that lack automated ingestion will struggle to keep up.
What should you do now:
- Audit your GST field completeness against the current e-invoicing schema. Missing or incorrect HSN codes trigger rejections, not warnings.
- Baseline your scorecard metrics this quarter. If you cannot measure completeness and accuracy today, you cannot prove improvement next quarter.
- Evaluate whether your current tools support daily bank syncs and real time exception alerts. AI Accountant's GST reconciliation workflows handle GSTR 2B matching and exception surfacing without manual downloads.
The cost of inaction is concrete: missed ITC claims, penalties on late e-invoice generation (up to ₹50,000 per return under Section 122), and audit flags that consume partner hours. The firms that built scorecards in 2025 are now operating with 24 hour freshness and sub 2% exception rates. The gap is widening.
Who Needs This and Why Now
Picture this. It is 10 PM and you are staring at yet another GST mismatch. Your bank reconciliation still has unexplained entries. The CFO wants updated cash flow numbers by morning.
These late night firefights often stem from one root cause: poor data quality that nobody saw coming.
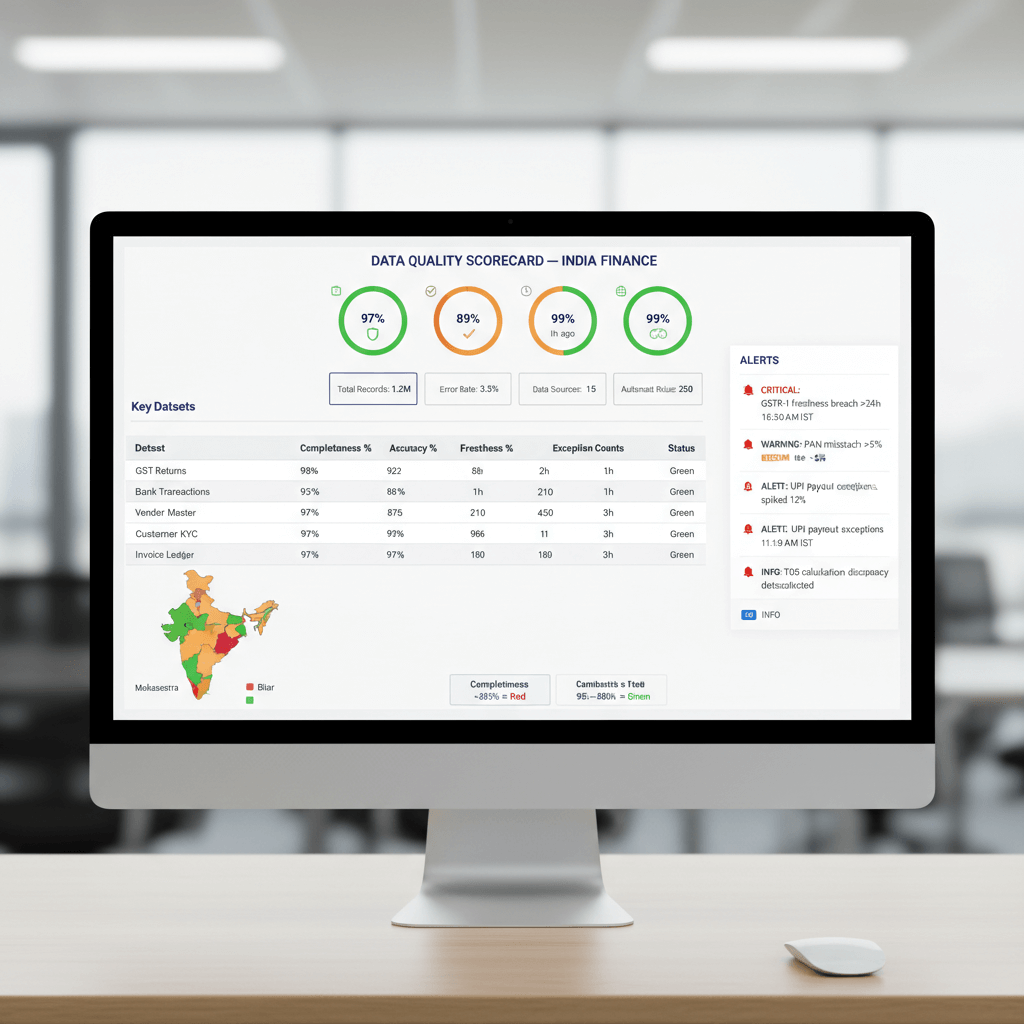
A data quality scorecard for Indian finance teams is your early warning system. It is a repeatable framework that produces a 0 to 100 trust score across Tally, bank statements, GST workflows, and internal processes. Think of data quality scorecards and alerts as quiet guardrails that catch silent errors before they become midnight emergencies.
The Reserve Bank of India has elevated expectations with the Supervisory Data Quality Index (sDQI), focusing on completeness, accuracy, timeliness, and consistency. These principles apply perfectly to SMB finance teams managing diverse data sources.
Indian businesses face unique challenges: diverse bank statement formats, complex GST requirements, and scattered payment references. This scorecard builds on those foundations to create comprehensive monitoring across every data touchpoint.
While you might not be a bank, your stakeholders expect bank level accuracy, timeliness, completeness, and consistency. The scorecard adds a quality layer, complementing Tally or Excel, without disrupting your workflows.
What is a Data Quality Scorecard (India Specific Framing)
A data quality scorecard for Indian finance teams is a single dashboard tracking data health across Ingestion, Classification, Compliance, and Reporting. It measures quality using core dimensions from data engineering best practices: completeness and accuracy metrics, freshness checks, consistency, and exception counts.
India specific complexity demands support for GST codes and rates, GSTR 2B reconciliation, TDS and TCS, and chaotic bank statement formats like PDFs, CSVs, Excel files, and scanned images. Include UPI references, payment gateway settlement IDs, forex conversions, and clean vendor and customer master data.
Align to the RBI's sDQI dimensions. It is proven and practical. Outcomes you can expect include fewer reconciliation surprises, faster GST filings, trustworthy MIS, and clear cash visibility.
Aim for a composite score of 95 or higher. Anything lower should trigger alerts and corrective action.
Use a thoughtful weighting model. For example, completeness and accuracy metrics at 40% each, freshness checks at 15%, and exception counts at 5%. Calibrate weights based on maturity and regulatory focus.
Make ownership mapping explicit. Who uploads bank statements? Who reviews ledger mappings? Who approves exception resolutions? Without clear ownership, issues linger.
Finally, institutionalize the monthly review. A regular rhythm to assess trends, address issues, and continuously improve data quality posture.
Helpful resources: RBI's sDQI methodology. Broader references include ICAI guidance on internal financial controls and industry frameworks for data quality for finance.
Core Dimensions and KPIs
Completeness and Accuracy Metrics
Let us get specific about completeness and accuracy metrics, the twin pillars that should represent 80% of your composite score.
Completeness asks whether you captured everything you should. One practical formula: Completeness % equals ((rows captured minus duplicates detected) divided by rows expected) times 100.
- Bank ingestion completeness: percentage of bank transactions captured versus bank statement total. If the statement shows 500 transactions and your system captured 480, completeness is 96%.
- Mapping completeness: percentage of transactions mapped to ledgers or vendors.
- Billing completeness: percentage of invoices and vendor bills captured versus operational systems.
- GST completeness: percentage of HSN codes, tax rates, and place of supply populated.
Accuracy measures correctness. Are captured transactions classified correctly? Do tax calculations add up?
- Ledger mapping accuracy: validated via periodic reviews, target more than 98% mapping accuracy.
- GST code accuracy: consistency of HSN and SAC codes across ledger entries.
- Tax calculation precision: CGST, SGST, and IGST calculations must match exactly.
- Bank to books reconciliation match rate: percentage of perfectly reconciling transactions.
- Duplicate detection precision: catch duplicates without false positives.
Recommended weights: completeness 40%, accuracy 40%, reflecting critical importance. Reference: data quality for finance.
Freshness Checks
Freshness checks ensure timeliness. How quickly do transactions move from occurrence to your books?
- Average Transaction Latency in hours: average of posting date minus transaction date. Three day lags mean stale cash visibility.
- Sync Freshness in hours: now minus last sync timestamp. When did you last pull from Tally?
- Days since last bank upload: weekly gaps undermine reconciliation.
Set SLAs. Transactions within 24 hours. Invoices within 48 hours. Weekly GST updates at minimum.
Configure staleness flags and thresholds. Trigger alerts if latency breaches SLAs or if no bank upload occurs for more than 2 days. See data quality for finance.
Exception Counts
Exception counts track items requiring human attention before filing or closing books.
- Failed uploads that could not be processed automatically.
- Duplicate transactions requiring manual review.
- Unmapped entries lacking ledger or vendor assignments.
- GST mismatches versus GSTR 2B downloads.
- Out of period postings affecting prior closes.
- Negative balances in ledgers that should not go negative.
- Growing suspense ledger balances indicating classification issues.
Track exceptions by severity and root cause. Calculate Exception Rate: open exceptions divided by total transactions in the period, times 100.
Monitor median time to close by type. Slow GST mismatch resolution indicates process gaps.
Ownership Mapping
Ownership mapping uses RACI (Responsible, Accountable, Consulted, Informed) across workflows.
- Bank ingestion: who uploads statements, who reviews completeness, who is consulted on exceptions.
- Bills processing: who enters vendor invoices, who approves, who is informed about delays.
- Ledger mapping: who performs initial mapping, who validates accuracy, who approves changes.
- GST reconciliation: who downloads GSTR 2B, who matches with books, who resolves mismatches.
- Tally sync: who triggers syncs, who monitors freshness, who troubleshoots failures.
Define governance KPIs. Time to Resolution for exceptions by owner, with clear thresholds: Critical in 24 hours, High in 48 hours. Publish owner names and SLAs on your scorecard.
Monthly Review Cadence and Agenda
The monthly review transforms your scorecard from passive reporting to active improvement. Create a three tier cadence: weekly operational checks, consolidated monthly reviews, and quarter end deep dives.
- Trend analysis of completeness and accuracy metrics. Improving or degrading?
- Open versus closed exception counts. Are we keeping up?
- Freshness checks adherence and drift versus SLAs.
- Risks ahead of GST filings. Red flags for upcoming returns.
- Ownership mapping effectiveness. SLAs met or missed?
Document decisions, threshold updates, process tweaks, and training needs in an action log. Maintain an audit trail tied to the data quality scorecard.
Sample Scorecard Layout (Template Guidance)
A well designed data quality scorecard layout makes monitoring intuitive. Organize into Ingestion, Classification, Compliance, and Reporting.
- Metric Name: precise KPI.
- Definition: formula or method.
- Target: acceptable threshold.
- Current Value: latest measurement.
- Trend: movement versus prior period.
- Exception counts: number of issues in the area.
- Owner: accountable person per ownership mapping.
- Freshness checks status: last sync timestamp and latency metrics.
- Notes or Action: next steps.
Display composite score clearly with weights: completeness and accuracy metrics at 40% each, freshness checks at 15%, exception counts at 5%.
For CA firms, create client wise heatmaps and multi entity rollups for 50 to 100 plus clients.
Further reading: ICAI guidance on internal financial controls and crafting a data quality scorecard.
Step by Step Implementation Guide
Step 1: Define Scope
List systems in scope: Tally, bank statements, billing apps. Identify legal entities and reporting periods. Start focused. One bank account and accounts receivable or payable. Expand later.
Step 2: Establish Metric Definitions and Thresholds
Write explicit formulas. For completeness and accuracy metrics, document calculations. Completeness equals ((rows captured minus duplicates) divided by rows expected) times 100.
Set targets: more than 95% completeness, more than 98% accuracy.
Step 3: Automate Freshness Checks and Exception Logging
Configure scheduled syncs to Tally. Set latency SLAs: transactions within 24 hours, invoices within 48 hours. Build alerts for staleness and rising exception counts. See data quality for finance.
Step 4: Configure Ownership Mapping
Assign RACI across ingestion, classification, GST reconciliation, and sync workflows. Create approval queues for posting exceptions and reconciliation issues. Clear ownership mapping accelerates resolution.
Step 5: Run a Pilot and Baseline
Month 1: start with one bank account and bills module, measure baseline. Month 2: expand to all bank accounts, refine thresholds. Month 3: add GST reconciliation and full reporting coverage.
Compare baseline completeness and accuracy metrics to targets. Iterate.
Step 6: Institutionalize the Monthly Review
Publish a concise leadership summary with trends, breaches, and actions. Maintain a change log for threshold updates and process modifications. Make the monthly review a non negotiable calendar item. Consistency drives improvement.
How AI Accountant Can Support Your Scorecard Journey
When evaluating tools for your data quality scorecard, consider capabilities tailored to Indian finance. AI Accountant offers comprehensive automation for bank statement ingestion across PDF, CSV, Excel, and scanned images, using OCR and NLP trained on 50 plus Indian bank formats. This improves ingestion completeness and boosts accuracy through automated cleaning.
Other options exist: QuickBooks, Xero, FreshBooks, Tally Prime, and others. Yet India specific GST and statement complexities often require supplementary automation.
For completeness and accuracy metrics, AI Accountant's ledger mapping and posting automation predicts ledger accounts, GST codes, vendors, and payment modes. It auto links invoices and bills from Tally to reduce manual classification by up to 75%.
One click syncs with Tally support freshness checks through bi directional integration, keeping books current and reducing latency.
Dashboards highlight Revenue versus Expenses, Profit margins, Cash Flow trends, and Transaction Categorization. They surface exception counts and freshness signals that drive your monthly review.
AP and AR automation tracks totals, current, and overdue amounts, including aging analysis. DSO and DPO insights improve completeness by ensuring comprehensive invoice and bill coverage.
Roadmap items include GSTN integration for GSTR 2B auto fetch and GSTR 1 push, Account Aggregator bank feeds, AI reconciliation assistants for anomaly detection, and multi entity rollups for CA firms managing 50 to 100 plus clients. Certifications like ISO 27001 and SOC 2 Type 2 support governance and auditability.
India Specific Pitfalls and How to Avoid Them
Vendor or Customer Master Hygiene
Poor master data drags completeness and accuracy metrics down. The remedy: schedule audits, enforce GSTIN, PAN, and addresses, normalize names to avoid duplicates.
Dirty vendor masters are one of the most common reasons ledger mapping accuracy stalls below 95%. A quarterly cleanup cadence is the minimum for firms processing more than 500 transactions per month.
GST Mismatches Treated as Filing Only Issues
Reframe GST matching as an accuracy KPI inside the scorecard. Include GSTR 2B match rate weekly. Fix root causes early, not during filing week.
With the e-invoicing threshold now at ₹1 crore, more businesses face real time validation. Mismatches caught at filing time often trace back to incorrect HSN codes or place of supply errors entered weeks earlier. Refer to the GST portal for current e-invoicing schema requirements.
UPI and Payment Gateway References Ignored
UPI transaction IDs and gateway settlement references are critical for reconciliation accuracy. Implement normalization rules for narrative references. Parse UTR numbers and settlement identifiers.
As UPI volumes continue to grow (crossing 16 billion monthly transactions in early 2026), ignoring these references creates a widening reconciliation gap. Regex based extraction and de duplication are table stakes.
No Clear Ownership Mapping
Undefined RACI roles and loose SLAs allow exceptions to linger. Assign specific owners per module. Set clear SLAs. Publish exception queues with owner names and targets.
No Freshness Checks
Stale MIS leads to poor decisions. Enforce strict SLAs: transactions in 24 hours, invoices in 48 hours. Automate alerts inside your data quality scorecards and alerts system.
Real World Success Story
A Bangalore based CA firm managing 60 SMBs implemented a data quality scorecard across clients. They started with bank ingestion, then expanded to ledger mapping and GST reconciliation.
Before the scorecard, GST filing weeks meant all nighters. Bank reconciliations dragged. Monthly reports arrived late.
After two monthly review cycles, results were compelling:
- Completeness improved from 92% to 95%.
- Accuracy rose from 94% to 98%.
- Exception counts fell 30%.
- Freshness improved from three day posting lags to under 24 hours.
Structured monthly reviews replaced filing panic with steady progress. Weekly dashboards improved transparency. Evenings were reclaimed thanks to early warnings that surfaced issues during business hours.
Next Steps and Resources
Ready to implement your data quality scorecard? Start by downloading a simple scorecard template in CSV or Google Sheets. Include fields for completeness and accuracy metrics, freshness checks, exception counts, ownership mapping, and monthly tracking tabs.
- Begin with a pilot on one entity or workflow. Bank reconciliation or GST matching are practical choices.
- Establish baseline metrics. Expand gradually to more entities and workflows.
- Schedule your first monthly review early. Use the meeting to reveal gaps and drive improvements.
The goal is a sustainable rhythm of measurement, review, and improvement. Your data quality scorecards and alerts system will evolve as you learn what matters most in your context.
Midnight reconciliation panics are optional. With early warnings you will catch issues during regular hours.
Frequently Asked Questions
How is a data quality scorecard different from regular MIS reporting
MIS reports show business performance like revenue, expenses, and profitability. A data quality scorecard measures trust in the underlying data using completeness, accuracy, and freshness metrics. Think of MIS as the movie, and the scorecard as the film quality check.
What is the simplest way to calculate completeness and accuracy percentages for bank ingestion
Completeness equals (captured rows divided by expected rows) times 100. Accuracy equals (correctly classified entries divided by total entries) times 100. Start with these formulas in Excel or your data tool, then automate them in your ETL or observability layer as you scale.
What freshness SLAs should a small CA firm set for daily operations
Target transactions posted within 24 hours and invoices within 48 hours. Add alerts for sync freshness (now minus last sync) and days since last bank upload. With Account Aggregator feeds becoming available in 2026, daily sync SLAs are increasingly realistic (2026 update).
Which exception types must be cleared before GST filings to avoid penalties
Prioritize GST mismatches versus GSTR 2B, unmapped transactions missing GST codes, and duplicates that distort taxable values. With the e-invoicing threshold at ₹1 crore from April 2025, incorrect HSN codes or place of supply fields now trigger upload rejections rather than just warnings (2026 update).
How often should a CA firm run reviews if weekly closes are already practiced
Continue weekly operational reviews for urgent items. Maintain a monthly review for trends, threshold resets, and governance decisions. The monthly perspective cuts noise and drives sustained improvements.
What composite score indicates data is ready for ledger posting without surprises
A composite score of 95 or higher typically indicates readiness. Use weights: completeness and accuracy at 40% each, freshness at 15%, exception counts at 5%. Anything below 95 should trigger alerts, owner assignment, and a remediation plan before posting.
How can a CA firm scale the scorecard across 50 to 100 clients without overwhelming the team
Adopt a standard template, instrument core KPIs, and implement multi entity rollups with heatmaps. Automate ingestion, classification, and alerts. Then run a monthly review cadence per client plus a consolidated firm wide review. This layered approach keeps workload manageable even at scale.

Rohan Sinha is a fintech and growth leader building aiaccountant.com, focused on simplifying accounting and compliance for Indian businesses through automation. An IIT BHU alumnus, he brings hands-on experience across 0 to 1 product building, growth, and strategy in B2B SaaS and fintech.