Key takeaways
- An ROI calculator dashboard for India centralizes IRR, NPV, and payback calculations in one view, pulling real transaction data from Tally so finance teams get answers in minutes instead of days.
- Automating cash flow preparation and scheduled NPV refreshes cuts manual reporting work by 70 to 80 percent, eliminates formula errors, and gives boards current numbers instead of stale estimates.
- India specific inputs matter: INR inflation bands, GST input credit timing, dual depreciation schedules, and hurdle rates benchmarked to FD yields or WACC must be baked into every calculation.
- Clean, tagged data is the bottleneck. Most dashboard failures trace back to messy transaction categorization, not bad formulas. Solving this upstream saves everything downstream.
- Teams that delay setting up proper investment return tracking risk board decisions based on incomplete or outdated information, every month without automation is a month of avoidable risk.
- AI Accountant's bookkeeping automation ingests bank and card statements, normalizes transactions, and maps them to projects, feeding clean data to your IRR tools and payback dashboards without manual rework.
ROI Calculator Dashboards in India: What's New in 2026
The biggest shift for Indian finance teams building ROI dashboards in 2026 is the expanding GST e-invoicing mandate. Until March 2025, e-invoicing applied to businesses with turnover above ₹5 crore. From April 2025, the threshold dropped further, pulling a much larger share of SMEs into the compliance net. This means more structured transaction data flowing through the GST portal, which directly affects how capex and opex entries land in your books and, by extension, your NPV and payback models.
For teams computing post-tax IRR, the CBIC's updated e-invoicing notifications now require additional data fields on every invoice. If your project tagging in Tally does not capture these fields, your cash flow exports will need manual patching before they reach any dashboard. That is exactly the kind of upstream data problem that breaks automated NPV refreshes.
The RBI's repo rate movements through 2025 and into 2026 have also shifted WACC assumptions for many SMEs. Discount rates that were set at 10 to 11 percent in early 2024 may now need recalibration. The Reserve Bank of India's monetary policy updates should feed directly into your sensitivity panels. Ignoring this means your IRR hurdle comparisons could be off by 100 to 200 basis points, enough to flip a project from "go" to "no-go."
Who does this hit hardest? Manufacturing and trading SMEs with capex heavy investment portfolios and firms that import equipment (where FX volatility compounds the WACC question). Service businesses with lighter capex feel less impact, but still need updated discount rates for marketing and product launch ROI models.
Cost of inaction is tangible: incorrect ITC claims due to mismatched e-invoice data can trigger GST notices and interest at 18 percent per annum. Stale hurdle rates lead to capital misallocation.
- Audit your Tally project tags against the latest e-invoice field requirements before your next month-end close.
- Update WACC and discount rate assumptions in your NPV models to reflect current repo rate levels.
- Run a reconciliation of GST input credits claimed versus credits reflected in your GST reconciliation workflow to catch mismatches early.
Teams using automated MIS reporting can push updated discount rates and refreshed cash flows to dashboards without rebuilding models from scratch.
Table of contents
Introduction
Managing investment returns should not feel like solving a puzzle with missing pieces. Yet for Indian SMBs, CA firms, and startup finance teams, Excel models and scattered sheets often become the default for tracking returns.
Board meeting tomorrow. You are consolidating data from multiple spreadsheets. Marketing wants campaign ROI. Operations wants capex justification. Everyone wants real numbers, not estimates.
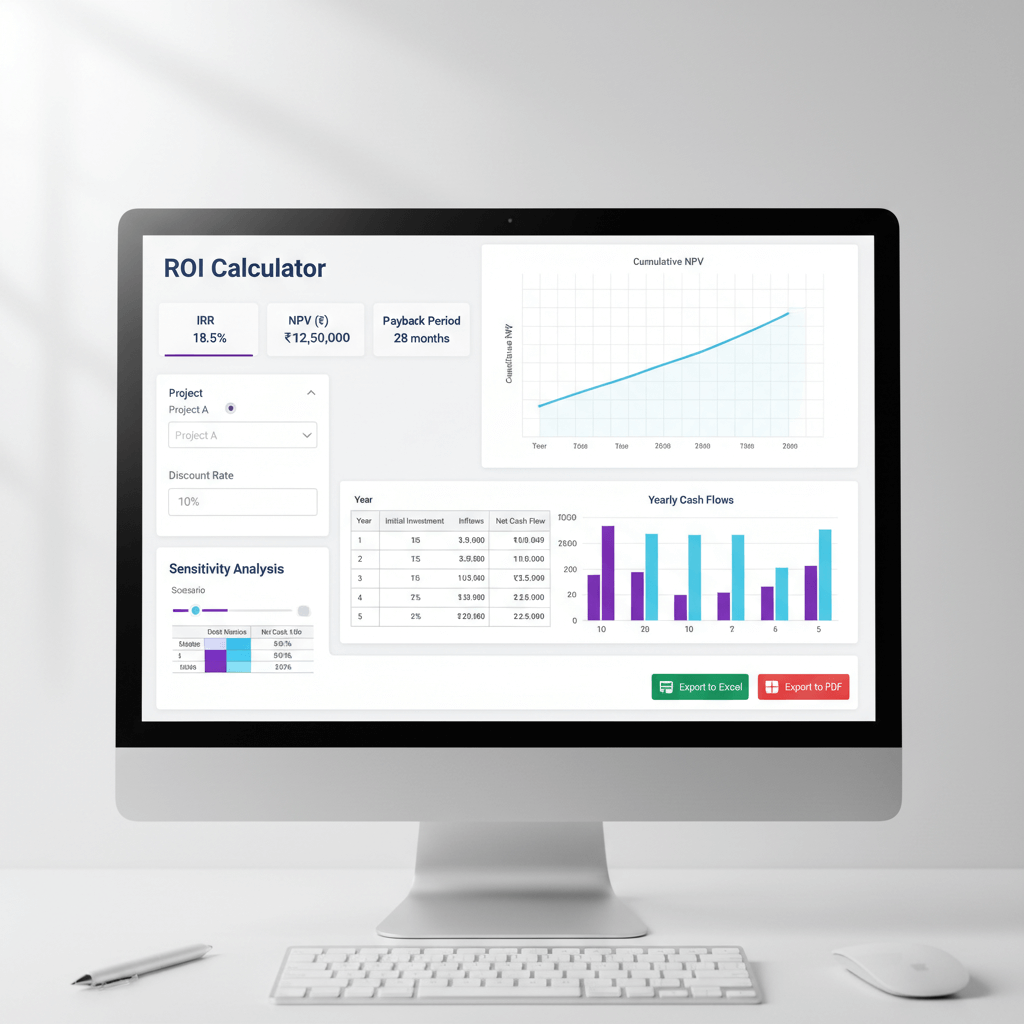
What finance teams really need are centralized ROI calculator dashboards with a robust payback view, flexible IRR calculations, and automated NPV refreshes, all driven by clean, real world cash flows.
ROI shows net profit divided by investment cost. IRR finds the discount rate that makes NPV zero. NPV calculates the present value of cash flows minus the upfront investment. Payback period tells you when the investment breaks even.
Doing all of this across multiple projects while managing INR inflation and compliance nuances is where teams lose hours monthly. Automating NPV analysis changes the game. It gives timely insights when you need them most.
Tip for CFOs and CAs: start with one project, validate cash flow mapping, then scale portfolio IRR and payback reporting once data pipelines are proven.
Understanding the India-Specific Context for ROI Calculation
India specific ROI work must reflect inflation, benchmark rates, tax treatment, and exchange rate realities.
Inflation typically runs in the 4 to 6 percent band. Fixed deposits yield about 6 to 7 percent. Bank loans cost roughly 8 to 12 percent. Venture investors target 15 to 25 percent. Your hurdle rates should mirror these benchmarks.
Tax treatment matters. Distinguish pre-tax and post-tax cash flows. Factor GST input credits into net investment. Align depreciation between Companies Act schedules (MCA) and Income Tax Act rules. Some firms also consider MAT (Minimum Alternate Tax).
Most Indian businesses run on Tally or Zoho Books. A reliable data pipeline from books to dashboards converts raw transactions (ledger entries) into project cash flows. These form the backbone for ROI, IRR, and NPV.
For decision making, finance teams benefit from a project profitability dashboard that surfaces project level returns and variances.
When importing equipment or paying foreign vendors, exchange rate changes impact realized returns. Ensure your dashboard captures FX gains or losses tied to each project.
Essential Features Every ROI Calculator Dashboard Needs
A proper ROI calculator dashboard for Indian businesses must combine reliable ingestion, robust calculations, and governance.
- Automated ingestion from Tally or Zoho Books, mapping transactions (ledger entries) to projects without manual rework.
- Portfolio and project level IRR calculation tools, with sensitivity controls for timing and amounts.
- Scheduled, automated NPV analysis that refreshes as new postings land at month end.
- Intuitive payback period timelines that show break even points clearly. Color coded views help for quick status checks.
- Coverage for capex, marketing spend, product launches, operational improvements, and mixed investment types.
- Scenario testing for interest rate changes, cost overruns, launch delays, and FX shocks.
- Governance via user roles, audit trails, and data lineage to ensure accuracy and accountability.
- Security with ISO 27001 and SOC 2, India data residency for regulatory comfort.
As a reference point, you can compare public tools like the ClearTax return on investment calculator, then map those concepts to your internal dashboard with richer data and governance.
Comparing ROI Dashboard Solutions for Indian Businesses
Spreadsheets: Excel and Google Sheets
Spreadsheets are flexible and familiar. Excel includes IRR and NPV functions. But manual updates, formula errors, multi-project rollups, and version chaos become recurring risks.
BI tools: Power BI, Zoho Analytics, Tableau
BI platforms excel at visuals, scheduled refreshes, and role based access. However, they demand clean inputs. Custom IRR measures may need technical skill. Ongoing model maintenance is common as business needs evolve.
Dedicated planning apps: Causal, Pigment, Anaplan
Planning apps bring robust scenarios, version control, and collaboration. Licensing costs can be substantial. Integrations to Tally or Zoho Books may require custom work. Training time adds to total effort.
AI powered automation and accounting tools
- AI Accountant automates cash flow preparation for NPV analysis by ingesting bank and card statements, normalizing transactions, and mapping them to projects. With deep Tally sync, GST reconciliation, encrypted servers, ISO 27001, and SOC 2 Type II, it acts as the data engine that feeds BI tools or Excel.
- QuickBooks: good for basic project tracking and custom reports. Limited advanced calculations for IRR and portfolio NPV.
- Xero: project tracking and profitability reporting with add-ons for ROI. Strong cloud integrations.
- FreshBooks: simple project accounting for services. Better for straightforward profitability than complex investments.
- Sage Intacct: enterprise grade dimensional reporting. Powerful but higher cost.
Positioning: AI Accountant sits as the automation layer. It ingests statements, categorizes transactions, separates capex and opex, syncs back to the accounting system, and provides clean data to your IRR tools and payback dashboards in whichever visualization platform you prefer.
Step-by-Step Implementation Guide for Your ROI Dashboard
Step 1: Define project scope
Document each investment. Capture initial outlay. List expected inflows and outflows by period. Set the time horizon. This foundation drives the calculation logic.
Step 2: Configure your accounting system
Set up proper ledgers and tags in Tally or Zoho Books. Separate capex, opex, and revenue. Tag transactions by project from day one. Good setup yields clean data.
Step 3: Connect data automation
If using AI Accountant, connect it to your books. Configure mapping rules to auto-categorize. Align project tags and cost centers. Eliminate manual classification work.
Step 4: Export clean datasets
Extract monthly cash flows with tax treatment. Ensure capex and opex split correctly. Include GST credits. Export clean data to Excel, Power BI, or Zoho Analytics for analysis.
Step 5: Build key measures
Create IRR measures at project and portfolio levels. Implement NPV formulas with appropriate discount rates. Build cumulative cash flow for your payback dashboard. Test each formula with sample data.
Step 6: Validate against source data
Cross check dashboard numbers against accounting records. Verify GST inclusion. Confirm tax treatment accuracy. Add workflow approvals before report distribution.
Step 7: Schedule and distribute
Set automatic refreshes and scheduled report sends for stakeholders. Tailor views by audience. Most setups take one to two weeks, then run automatically.
Dashboard Design Best Practices for Indian Finance Teams
Executive summary view
Show ROI by project. Rank investments by IRR. Display total portfolio NPV. Compare actual payback periods to targets. Use a simple traffic light metaphor for quick status.
Investment timeline tracking
Plot cash flow timelines. Highlight plan versus actual variance. Mark milestone dates. Display running ROI. This makes performance over time visible and actionable.
Sensitivity analysis panel
Include discount rate sliders. Add toggles for market conditions. Show impacts of overruns and delays. Let users test assumptions interactively.
Detailed drill downs
Enable ledger level drill to show GST impact, capex versus opex splits, and links back to source entries in Tally or Zoho Books.
Alert configuration
Notify when payback breaches targets. Flag negative NPV. Alert when IRR drops below hurdle rates. Send updates on significant metric changes.
Real-World Case Study: SME Manufacturing Company
A mid-sized manufacturing firm in Chennai tracked returns for a two crore factory equipment upgrade and a fifty lakh digital marketing campaign.
Before the dashboard, the finance team spent three days each month consolidating data. Excel sheets multiplied. Numbers disagreed across departments. Board packs carried stale data.
They connected AI Accountant to Zoho Books. Cash flows auto-tagged to each project. Equipment purchases, installation, and maintenance mapped to the factory. Ad spend and agency fees mapped to marketing.
Manual data prep dropped by ninety percent. Monthly IRR and payback updated automatically. Board members saw real time NPV, not last month's estimates.
The factory upgrade delivered eighteen percent IRR versus a twelve percent hurdle. Payback came in at about 4.2 years. The marketing campaign achieved thirty five percent ROI within six months.
Typical results include:
- 70 to 80 percent reduction in reporting time
- 2 to 3 days faster month end close
- Sharply improved accuracy across all investment metrics
Common Pitfalls and How to Avoid Them
- Mixing nominal and real rates: keep inflation treatment consistent across cash flows and discount rates.
- Confusing accounting profit with cash flow: ROI needs actual cash movement. Depreciation affects profit but not cash. Model timing of cash explicitly.
- Sign convention errors: standardize outflows as negative and inflows as positive to prevent incorrect IRR.
- Forgetting GST credits: include GST input credits in net cash flows, else you understate returns. Refer to the GST portal for current ITC eligibility rules.
- Inconsistent periods: align monthly or quarterly structures uniformly.
- Ignoring working capital changes: inventory buildup and receivables tie up cash. Include these impacts.
- Wrong discount rates: match discount rates to risk levels and project profiles. Cross reference RBI policy rate announcements when recalibrating WACC.
Cost, Effort, and Timeline Expectations
Initial setup: one to two weeks. Configure tags in Tally or Zoho Books, mapping rules in AI Accountant, and build key views. Testing and validation round out the process.
Ongoing maintenance: mostly automated. Monthly refreshes run on schedule. Mapping updates are occasional. New projects can be added within minutes.
Cost structure: license an automation layer, optional BI platform costs for Power BI Pro or Zoho Analytics, training is limited since teams use familiar tools. Typical monthly range is fifteen thousand to fifty thousand rupees depending on scale.
Resources: one finance team member can manage. Light IT support for integrations. Normal dashboarding skills suffice.
ROI on the dashboard itself: most firms recover setup costs within two months. Time savings plus higher decision quality deliver quick payback. Faster reporting enables quicker strategic pivots.
Decision Checklist for Choosing Your ROI Dashboard Solution
Integration capabilities
- Import from Tally or Zoho Books, bank and card statement ingestion.
- Bi-directional sync with your accounting system.
Calculation features
- Accurate payback period calculations with cumulative cash flows.
- Reliable IRR and NPV with minimal manual work. Portfolio views.
Automation level
- Scheduled refreshes that enable NPV analysis automation.
- Auto-categorization and project tagging to reduce manual prep.
Security and compliance
- ISO 27001, SOC 2, India data residency.
- Audit trails and data lineage.
Usability
- Works without extensive training. Integrates with tools you already use.
- Scales with business growth.
Cost considerations
- Transparent pricing model. Limited hidden costs.
- Total cost of ownership, including training and maintenance, fits your budget.
Choose a solution that checks most boxes for your context. Progress beats perfection. Build iteratively.
Moving Forward with Confidence
Building an effective ROI calculator dashboard transforms how finance teams operate. No more pre-board scrambling. No more outdated spreadsheets. No more guesswork.
The winning combination is automation for data preparation and visualization for insight delivery. AI Accountant handles ingestion and normalization. Your BI or Excel layer presents clean metrics.
Start with a pilot. Configure basics. Test calculations. Refine views. Then scale to the portfolio. Keep the focus on clean data capture and categorization because perfect calculations require perfect inputs.
Do not wait for the perfect moment. Each month without proper investment return tracking risks decisions based on incomplete information. Stand up reliable ROI reporting in weeks and give your team the numbers they need, when they need them.
FAQ
How should a CA set the discount rate for NPV in India when inflation is 4 to 6 percent and the firm's WACC changes quarterly?
Set discount rates by project risk, not by convenience. Use a real discount rate if your cash flows are in real terms, and a nominal rate if cash flows include inflation. For quarterly changes, maintain a policy note and update the WACC inputs each quarter. Keep a sensitivity panel in your dashboard for ±100 to ±300 basis points scenarios. Cross reference the latest RBI repo rate when recalibrating (2026 update).
How do I compute post-tax IRR in India when depreciation differs under Companies Act and Income Tax Act schedules?
IRR relies on cash flows, not book profit, so model tax shield effects as cash impacts. Estimate tax outflows net of depreciation shields, then compute IRR on post-tax cash flows. Keep two depreciation schedules in a driver table. Update life and rate assumptions annually and validate against statutory filings.
What is the correct approach to include GST input credits in ROI, NPV, and payback period for capex purchases?
Treat GST input credits as reductions to effective investment cost when recoverable. Include credits in early period cash inflows or reduced outflows, then compute NPV, IRR, and payback on net cash. Document eligibility and timing, match filing periods to cash flow timing, and reconcile credits to GSTR returns. Your dashboard should show a GST impact section to avoid understating returns.
What sensitivity tests should a CA include for IRR and payback in a manufacturing capex model?
Test cost overruns at 10 to 30 percent, start delays by 1 to 6 months, utilization at 60 to 90 percent, maintenance costs up 20 percent, and discount rate shifts of ±200 basis points. Reflect FX volatility if imports are involved. Show IRR, NPV, and payback for each scenario, and include a base, downside, and upside case in the board pack.
Which governance controls should I implement for ROI dashboards in a multi-user finance environment?
Enable role based access, audit trails, and data lineage as a baseline. Centralize measure definitions and restrict structural changes to model owners. Maintain a change log and review monthly. Standardized, automated data inputs reduce human error significantly compared to manual uploads.
What is the quickest path to stand up an ROI dashboard if my team is short on modeling capacity?
Automate cash flow preparation first, then export clean datasets and implement IRR, NPV, and payback measures in Power BI or Excel. Start with one project. Validate against source ledgers. Then scale to portfolio views. Expect one to two weeks for a functional dashboard.

Rohan Sinha is a fintech and growth leader building aiaccountant.com, focused on simplifying accounting and compliance for Indian businesses through automation. An IIT BHU alumnus, he brings hands-on experience across 0 to 1 product building, growth, and strategy in B2B SaaS and fintech.