-01%201.svg)
Key takeaways
- A project profitability dashboard for India gives you one consolidated view of costs, margins, collections, GST input credits, and TDS impact, replacing end-of-project surprises with stage-by-stage visibility tied to milestone-based invoicing.
- Advanced analytics on project profitability vendor costs reveal which vendors consistently drive overruns. Catching these patterns early can recover 5% to 10% of project margin before it leaks away.
- Precision depends on integrated data: connect your dashboard to Tally, bank feeds, and GSTR-2B sources for daily updates that net GST credits and reflect TDS deductions accurately.
- Manual vendor bill matching and GST reconciliation eat 10+ hours weekly. AI Accountant automates bill extraction, GSTIN validation, and 2B matching end to end, cutting errors and freeing capacity for judgment work.
- Project-wise profitability reports with drill-downs to source bills, bank transactions, and reconciliation artifacts make every number traceable, eliminating spreadsheet gymnastics.
- Adopt a phased playbook (data hygiene, ingestion, reconciliation, go-live with threshold alerts) and most teams reach accurate dashboards within 4 to 6 weeks.
Profitability Dashboards and Vendor Cost Analytics: What's New in 2026
The biggest operational shift in 2026 is not a regulatory change. It is the expectation of real-time vendor cost visibility inside profitability dashboards. In 2025, most Indian firms reconciled vendor bills monthly or quarterly, often in spreadsheets. In 2026, daily automated bill ingestion and predictive ledger mapping have become the baseline. Firms still running weekly manual cycles are finding margin leaks that auto-reconciled competitors catch on day one.
GST input credit rules, TDS mechanics, and GSTR-2B reconciliation requirements remain unchanged from 2025. However, the volume of transactions processed through automation has jumped significantly. Firms processing 500+ vendor invoices per month now expect auto-extraction, GSTIN format validation, and narration-based project tagging without manual intervention. Those below this threshold still benefit, but the payoff scales with volume.
Another notable shift: budget variance tracking has become tighter. In 2025, many teams discovered overruns only during quarter-end reviews. In 2026, dashboards auto-alert at 10% budget overrun thresholds, and actual versus budgeted hours analysis regularly reveals 25% to 40% overruns on complex projects. Rework effort, previously invisible, now surfaces as 15% to 30% of total project effort in firms that track it properly. Teams using automated MIS reporting with project-level drill-downs catch these variances within days, not months.
The cost of inaction is tangible. Delayed vendor bill matching means missed ITC claims in the filing period, triggering reversals and interest at 18% per annum. Untagged bills distort project-wise profitability reports, leading to mispriced bids on the next engagement. For CA firms managing multiple clients, a single unresolved GSTIN mismatch per client per month compounds into hundreds of hours of rework annually.
Who this hits hardest: mid-sized CA firms and SME finance teams managing 10+ active projects with 200+ vendor invoices monthly. If your bill turnaround exceeds 48 hours, you are leaking both margin visibility and ITC eligibility.
What to do now:
- Audit your current vendor bill turnaround time. If bills sit unmatched for more than 48 hours, you are leaking margin visibility.
- Ensure every vendor invoice maps to a project code at ingestion, not downstream during reconciliation.
- Validate that your GST reconciliation workflow catches GSTIN mismatches before the GSTR-3B filing deadline, not after.
Platforms that handle automated transaction posting and ledger entry classification natively now surface vendor cost anomalies as part of the daily sync, reducing the gap between data entry and decision-making to hours instead of weeks.
What is a Project Profitability Dashboard, India Context
A project profitability dashboard gives you a single window into project health. It aggregates revenue, costs, gross margins, cash position, and the gap between billed amounts and actual collections.
In India, milestone-based invoicing is standard. You need visibility into profitability at each stage, not just at the end.
The India-specific twist is the GST impact and TDS timing. When you reconcile input credits from GSTR-2B, net costs drop. When clients deduct TDS, cash arrives later, usually lower than invoice value. Without these adjustments, you overstate costs or cash, and your margins look misleading.
Think of it this way: a profitability dashboard that ignores GST credits and TDS deductions is like reading a P&L with half the line items missing. You make decisions on distorted numbers.
Finance wants margin trends, project managers want overrun alerts, founders want cash projections, and CA firms want consolidated views. The best profitability dashboards deliver all of it from one canonical data model.
Core Components and Metrics to Include
Project Cost Tracking
Capture every direct expense: vendor invoices tied to the project, subcontractor payouts, allocated payroll, travel claims. Do not ignore indirect costs. Allocate rent, admin salaries, and utilities with consistent rules. Apply defensible methods for overhead allocation so your margin math stays honest.
Keep data fresh with daily bank and bill syncs. Highlight overruns early. Factor GST input credits in cost views. A ₹1,18,000 vendor invoice may net to ₹1,00,000 after claiming ₹18,000 credit.
Advanced analytics on project profitability vendor costs should surface which vendors consistently drive overruns and which deliver within budget. Look for patterns in vendor pricing drift, late delivery penalties, and scope change charges that inflate project costs silently.
Even a 2% to 3% drift per vendor, compounded across a dozen projects, erodes margins fast. Track vendor cost drift as a standalone metric in your dashboard.
Resource Utilization Metrics
Measure how effectively your team's capacity converts to billable work. The basic math: billable hours divided by available capacity equals utilization percentage. If someone bills 120 hours out of 160, that is 75% utilization.
Non-billable overheads typically consume 20% to 35% of total effort. Tracking this split helps you understand true cost-per-deliverable.
- Track effective billing rate by resource. Identify discount leakage.
- Watch role-mix changes. Senior team members doing junior work will depress margins.
- Flag under-utilization and over-utilization. Sustain the 75% to 85% sweet spot.
- Use automated timesheet validation to catch anomalies like zero-hour weeks or impossible entries.
- Compare actual hours against budgeted hours per project. Overruns of 25% to 40% are common on complex engagements and often go unnoticed until it is too late.
Project Margin Analysis
Margin equals revenue minus total cost, divided by revenue. But the trend and bridge matter more than the static percentage.
Explain margin movement with pricing changes, scope creep, resource mix shifts, rework, and idle bench costs. Rework alone can account for 15% to 30% of project effort if left untracked.
- Alert any project trending below target. For example, 35% planned versus 25% actual.
- Use profit bridges to isolate drivers, then assign owners and fixes.
- Track discounts, write-offs, and disputed deliverables distinctly.
- Compare MoM and YoY margin trends to detect seasonal patterns or systemic issues.
Milestone Profitability Tracking
Indian services contracts release cash by stage. Your profitability dashboard should calculate profit per milestone: revenue recognized for the stage minus incremental costs incurred.
Keep invoices linked to milestones and collections. The TDS impact reduces cash and delays it, so timing matters. Automate alerts for overdue deliveries, cost overrun thresholds, and aging buckets for receivables.
For project-wise profitability reports, ensure each milestone maps to a unique invoice line and cost bucket. This is where most implementations break down.
Key Metrics at a Glance
| Metric | Purpose | India Twist |
|---|---|---|
| Gross Margin | Revenue minus total costs divided by revenue | Nets GST credits from GSTR-2B, reflects TDS on cash |
| Utilization % | Billable divided by available hours | Flags non-billable overheads (20% to 35% of effort) |
| Budget Variance | Actual versus planned spend | Auto-alerts at 10% overrun thresholds |
| Vendor Cost Drift | Per-vendor overruns over time | Patterns reveal 5% to 10% recoverable margin leaks |
Data Model and Integrations: Tally, Bank Feeds, and ERP Tools
Start with consistent masters in Tally or your ERP: items, ledgers, vendors, customers, and project codes. Run masters sync so new projects, vendors, and clients appear instantly in your dashboard.
- Ingest daily bank and credit-card statements. Normalize formats for clean posting.
- Pull vendor bills from PDFs, Excel, or CSV. Then map to projects and tax codes.
- Use GSTR-2B downloads for GST reconciliation. Validate purchase register against credits.
- Reporting tools can automate Tally pulls for P&L by cost center, budget versus actuals, and expense allocation by timesheets or headcount.
Mapping anchors transactions to the right projects. Without accurate mappings, your data becomes noise. Reconciliation ties payments to invoices, tracks advances, and resolves GST mismatches.
Some ERP tools compute per-hour project profitability via timesheets and hourly rates. This works well for time-and-material contracts but needs supplementation for India-specific GST and TDS adjustments.
How AI Accountant Supports This Dashboard
AI Accountant automates the data pipeline from bank and ledger sources, integrates with Tally, extracts bills in bulk, detects vendor mismatches, and posts normalized transactions without duplicates. Timesheet imports with validation power utilization and cost-per-hour views. Predictive ledger mapping and receipt-invoice linking streamline margin analysis. Invoice-milestone tagging enables per-stage profitability.
- Project cost tracking: bulk bill extraction, GSTIN validation, and bank ingestion.
- Resource utilization metrics: Excel timesheet validation, and role-wise rate application.
- Margin analysis: predictive mappings, split handling, and reconciliation automation.
- Milestone profitability: invoice tagging, real-time profit by stage, and aging visibility.
- Multi-org support for CA firms: role-based access, ISO 27001 and SOC-2 Type II compliance.
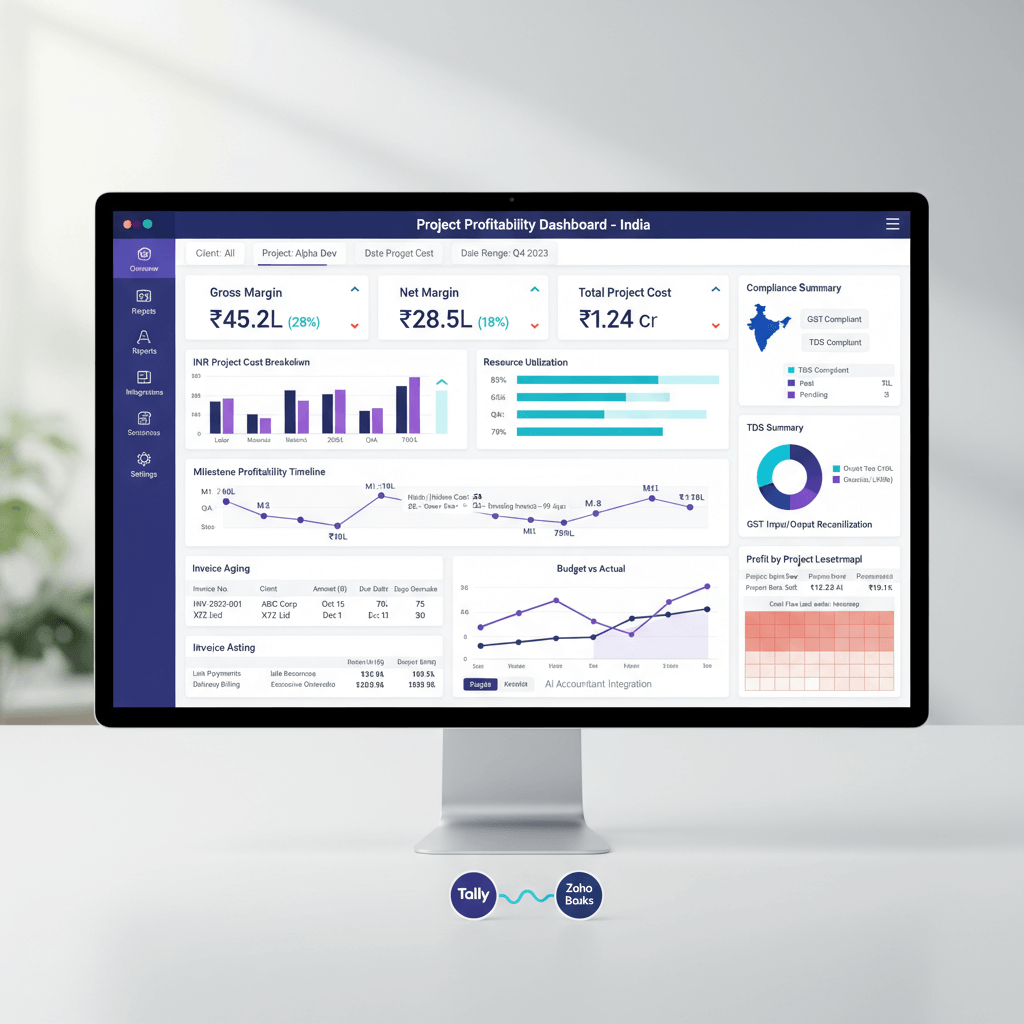
Example Dashboard Layout: What Buyers Should Expect
Expect top-level tiles for active projects, on-track versus at-risk status, cash collected versus billed, and GST input utilization.
A central table shows total revenue, total cost, gross margin percentage, WIP value, and AR aging.
- Utilization views by project and team: target versus actual, effective billing rates, bench tracking.
- Milestone tracking as timeline or Gantt: planned versus actual dates, status, revenue, costs, and profit.
- Drill-downs to source bills, bank transactions, and GST reconciliation artifacts. Every number is traceable.
- Sidebar filters for client, manager, risk flag, and date ranges to speed investigation.
- Project-wise profitability reports with export options for CA review and client presentation.
Power BI layers can add visual trend detection for MoM and YoY comparisons across projects and clients.
Implementation Playbook: Phased Approach
Phase 1: Data hygiene
Standardize project codes everywhere: invoices, expenses, and timesheets. Map your chart of accounts to separate project costs from overheads.
Define allocation rules with clarity. This is where most project profitability dashboard implementations succeed or fail.
Phase 2: Ingestion and mapping
Enable bank syncs. Set up bill uploads with templates. Import historical timesheets. Configure auto-tagging by narration and vendor. Reserve manual mapping for exceptions.
Build a mapping dictionary of narrations, vendor aliases, and reference numbers for fuzzy matching. This dictionary becomes the backbone of your automated ledger entry classification.
Phase 3: Reconciliation
Link receipts to invoices. Match the purchase register with GSTR-2B for GST credits. Resolve vendor name and GSTIN mismatches. Track advances and adjustments. Validate that net project costs reflect claimed credits accurately.
Phase 4: Go-live
Set margin thresholds, utilization targets, and collection aging buckets. Run parallel for one month. Iterate allocation rules. Train teams and institute review cadences.
Most teams achieve stable dashboards within 4 to 6 weeks using this phased approach.
Evaluation Checklist for Buyers
- End-to-end project cost tracking from bills and bank feeds, no heavy manual entry.
- Resource utilization via timesheet imports, validation, and rate application.
- Project margin bridges and trends. Not just arithmetic, but why margins moved.
- Milestone profitability with invoice linkages, because Indian projects bill by stage.
- India-specific requirements: Tally sync, GST reconciliation, and TDS handling.
- Data controls: validation rules, audit trail, and approval workflows.
- Scale and security: multi-org, ISO 27001, SOC-2, and data residency fit.
- Time-to-value: templates, implementation support, and go-live speed.
- Advanced analytics on project profitability vendor costs: ability to surface vendor-level cost patterns and flag overruns before they compound.
- Project-wise profitability reports: native export and drill-down without spreadsheet rebuilding.
Common Pitfalls and How to Avoid Them
- Missing tags on bills and receipts: enforce templates and validation rules. Train teams on tagging discipline from day one.
- Ignoring indirect cost allocations: define rules upfront and review quarterly to keep margins realistic.
- Weak timesheet quality: standardize imports, flag anomalies like zero-hour weeks, build compliance into reviews.
- Cash surprises from TDS and overdue collections: tie milestone profitability to actual collections, set aging alerts.
- Vendor master chaos: automate vendor detection, validate GSTIN formats, keep a clean single source of truth.
- Over-reliance on a single metric: a profitability dashboard should surface margin, utilization, and cash together. One metric in isolation misleads.
- Skipping vendor cost pattern analysis: without tracking which vendors consistently inflate project costs, you reprice bids using flawed assumptions.
- Ignoring rework tracking: rework can silently consume 15% to 30% of project effort. If you do not measure it, you cannot price it or prevent it.
Proof Points and Credibility Signals
Hundreds of Indian businesses, including CA firms, operate automated dashboards processing millions of transactions. This demonstrates reliability and scale.
Security matters. Look for ISO 27001 and SOC-2 Type II, so financial data stays protected with auditable trails.
Battle-tested integrations with Tally are essential. GST reconciliation, TDS handling, and multi-currency projects should be native. Modern platforms can stand up a live project profitability dashboard in days. Request a demo with your data to see real insights.
ERP tools extend to P&L trends and MoM/YoY comparisons, while Power BI layers enable visual trend detection. The market has matured: automation depth is the differentiator, not basic reporting.
FAQ
As a CA, how should I set up project codes and ledgers in Tally to avoid rework later?
Define a canonical project code schema, then enforce it across invoices, expense bills, timesheets, and bank mappings. Create cost centers or project dimensions for direct costs. Keep overhead ledgers distinct and document allocation rules. An AI layer like AI Accountant can auto-tag transactions using narration patterns and vendor mapping, cutting manual errors at scale.
How do I allocate indirect costs fairly across projects without inflating margins?
Choose a method appropriate to your cost drivers: headcount, revenue proportion, or hours. Apply the chosen method consistently, then test sensitivity quarterly. Implement allocations in your dashboard so margins reflect true economics, not estimates that drift over time.
What is the most practical approach for GST input credit reconciliation at a project level?
Reconcile your purchase register with GSTR-2B monthly. Flag vendor GSTIN mismatches early and adjust net project costs after valid credits. Credits should be mapped to projects during bill ingestion so your cost views stay net of GST, preventing expense overstatement that distorts project profitability. (2026 update) Daily automated reconciliation is now the standard for firms processing 500+ invoices per month, replacing the older monthly cycle.
Does my ERP have project profitability reports, or do I need a separate tool?
Most ERPs including Tally offer basic project profitability reports. Some compute profitability via timesheets and hourly rates (2026 update), while reporting tools automate Tally pulls for P&L by cost center. However, for India-specific needs like GSTR-2B reconciliation, TDS adjustments, milestone-level tracking, and multi-org CA workflows, a dedicated layer like AI Accountant fills the gaps that native ERP reports leave open.
How should I account for TDS deductions so cash and profitability views do not mislead stakeholders?
Track TDS at invoice level. Reflect gross revenue for margin calculations, but show cash net of TDS in collection and aging views. Tie milestone profitability to collections, not just to invoicing. Automated receipt-invoice linking keeps cash timing accurate in the dashboard.
Can I get project-wise profitability reports without heavy manual entry?
Yes. Automated bill extraction, bank ingestion, and narration-based auto-tagging eliminate most manual work. The key is standardized project codes and consistent vendor masters. With daily syncs from Tally and bank feeds, project-wise profitability reports update automatically, giving you real-time visibility without spreadsheet gymnastics.
Which margin thresholds and utilization targets work best for IT services and consulting in India?
Common utilization targets sit between 75% and 85%. Set role-wise targets for junior, senior, and leadership levels. Margin thresholds vary by segment: productized services often target 30%+ gross margin, custom projects may settle at 20% to 25%. Use margin bridges to diagnose changes, then adjust pricing or resource mix accordingly.
Does Zoho Invoice have project profitability reports?
No. Zoho Invoice does not offer native project-wise profitability reports with margin analysis, milestone tracking, or vendor cost breakdowns. It handles invoicing and payment tracking, but for project profitability dashboards that include cost allocation, utilization metrics, and GST reconciliation, you need a dedicated project profitability or accounting automation layer on top of your invoicing tool.
What does advanced analytics on project profitability vendor costs actually show?
It shows per-vendor cost trends across projects, highlighting which vendors consistently exceed budgets, submit late invoices, or trigger scope-change charges. The analysis surfaces patterns like 2% to 3% pricing drift per vendor that compound silently across engagements. With this data, you can renegotiate terms, switch vendors, or adjust bids before margin leaks become structural.

Rohan Sinha is a fintech and growth leader building aiaccountant.com, focused on simplifying accounting and compliance for Indian businesses through automation. An IIT BHU alumnus, he brings hands-on experience across 0 to 1 product building, growth, and strategy in B2B SaaS and fintech.