-01%201.svg)
Key takeaways
- Indian SaaS finance teams need revenue dashboards that reflect local realities, including GST breakdowns, payment method success rates, and RBI auto debit impacts, not generic global templates.
- Put five essentials front and center, MRR, ARR, Churn, CAC, and LTV, then add India specific views for GST collection efficiency, foreign exchange impact, payment success by method, and recognition lag.
- Choose tools that integrate cleanly with Indian systems, use AI Accountant for GST reconciliation and accounting integrations, pair with Chargebee or Razorpay Subscriptions for billing, and layer a pragmatic BI tool for visualization.
- Follow a four phase plan, data foundation, metric calculation, dashboard design, automation and alerts, so numbers are accurate, trusted, and updated without manual work.
- Build compliance ready workflows for GST reconciliation and revenue recognition, maintain data lineage, and prepare audit ready reports with variance analysis and historical snapshots.
- Adopt an operational cadence, daily revenue checks, weekly reviews, monthly deep dives, so insights lead to actions that improve cash flow, growth, and retention.
- Prevent common pitfalls by cleaning data, documenting definitions, training stakeholders, and managing technical debt, then evolve continuously as scale and regulations change.
- Above all, design for decisions, add context, recommendations, and quick links to next steps, so the dashboard moves teams from insight to impact every day.
Why Traditional Dashboards Fail for Indian SaaS Companies
The Compliance Complexity Nobody Talks About
Most Indian SaaS finance teams export payment data from Razorpay, pull subscription reports from billing, and reconcile GST in spreadsheets, by the time numbers are aligned, the dashboard is already outdated. Generic dashboards ignore Indian realities, they do not separate GST from revenue, they do not compare UPI versus card success rates, and they rarely flag churn risk from expiring cards ahead of RBI mandates. Your dashboard should speak the Indian SaaS language, show gross and net revenue with and without GST, flag thresholds for international revenue and documentation needs, and track payment failures by method so retry logic can be tuned.
Dashboards built for a different regulatory context create false comfort, build for India first, then add global views.
Essential SaaS KPIs and Metrics Every Dashboard Needs
Core Revenue Metrics That Matter
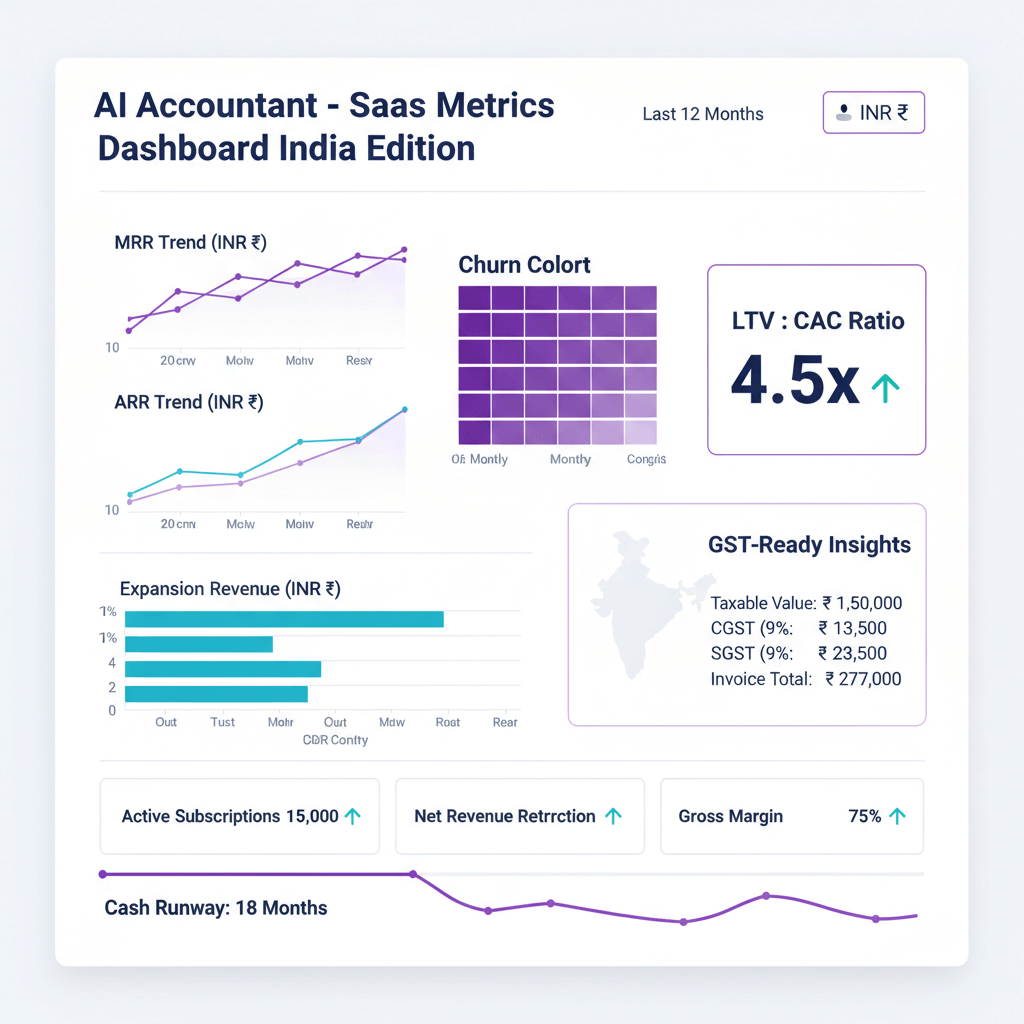
Your SaaS KPI dashboard should anchor on five metrics. Monthly Recurring Revenue, track INR and USD separately, currency moves can mask real growth. Annual Recurring Revenue, show contracted ARR versus recognized ARR, include annual payment discounts and multi year contracts common in India. Customer Churn Rate, segment by reason, payment method, and customer segment, payment failure churn needs a distinct view. Customer Acquisition Cost, include GST on marketing spend, free trials, and support overhead on compliance queries, CAC is often understated. Customer Lifetime Value, reflect expansion revenue and stronger retention on annual plans, model cohort specific retention rather than a single average.
India Specific Metrics You Cannot Ignore
Payment success rate by method is essential, track UPI, domestic cards, international cards separately, typical patterns are UPI near ninety five percent, domestic cards near eighty five percent, international cards near seventy five percent. GST collection efficiency compares GST collected with GST liability, widening gaps signal cash flow stress. Foreign exchange impact separates constant currency growth from reported growth, useful for investor communication. Revenue recognition lag measures delay between billing and recognition, annual payments, GST adjustments, and refunds all influence timing.
Choosing the Right SaaS Analytics Tools and Platforms
The Indian SaaS Tool Stack That Works
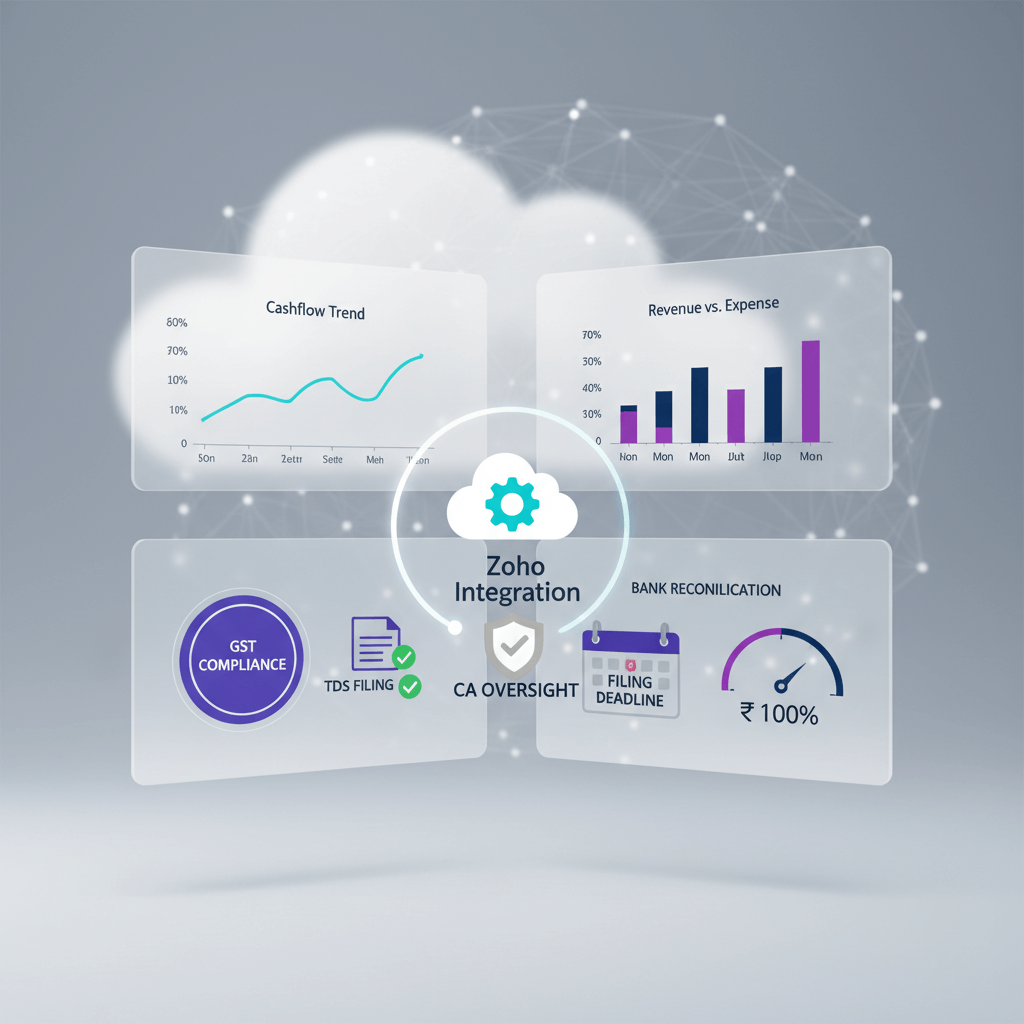
- Billing and subscriptions: AI Accountant for automated GST reconciliation and deep integrations with Zoho Books and Tally, Chargebee for complex pricing and GST invoices, Razorpay Subscriptions for payment first setups, Zoho Subscriptions for smaller teams, Stripe Billing for global revenue with India GST customization.
- Visualization: Tableau and Power BI for robust BI, Google Data Studio for quick starts, Baremetrics or ChartMogul for prebuilt SaaS views that need GST customizations.
- Payments: Razorpay as primary gateway for UPI, cards, and net banking, use webhooks to stream events into the dashboard, Cashfree and PayU as alternatives based on coverage and pricing.
Pick tools that minimize reconciliation work, the right stack reduces manual effort, and improves trust in numbers.
Integration Architecture That Scales
Use the billing system as the subscription source of truth, connect payment gateway events, sync to accounting for ledger accuracy, then centralize in a data warehouse or integration platform. Start with Zapier or Make for quick automation, move to Apache Airflow or lightweight custom APIs as volume grows. The goal is automated flow, daily refreshes, and zero manual exports.
Step by Step SaaS Dashboard Implementation Guide
Phase 1, Data Foundation, Weeks 1 to 2
Audit sources, confirm where subscriptions, payments, and customer records live. Create a data dictionary, define MRR inclusions and exclusions, discounts, one time fees, and GST treatments, document decisions for future consistency. Set up pipelines with APIs and webhooks, automate exports from accounting into a central store, and cleanse history, de duplicate customers, fill missing payment methods, and fix categorizations.
Clean data is the bedrock of a trustworthy dashboard.
Phase 2, Metric Calculation, Weeks 3 to 4
Implement formulas carefully, for MRR include recurring add ons, exclude one time fees, decide on paused subscriptions, calculate with and without GST. Define customer churn versus revenue churn, track downgrades as partial revenue churn. Build cohort views by signup month, Indian SaaS often has seasonal activation and retention patterns. Validate with manual spot checks on selected customers, reconcile automated outputs with hand calculations before moving forward.
Phase 3, Dashboard Design, Weeks 5 to 6
Place primary KPIs at the top with clear numbers and trend sparklines, group related metrics, MRR, ARR, growth rate together, CAC next to LTV for quick efficiency checks, payment metrics in a unified section. Use color intentionally for direction, avoid overload, align with brand when possible. Design role specific views, leadership wants trend summaries, finance needs detailed breakdowns, give filters for date, segment, product line, and set helpful defaults.
Phase 4, Automation and Alerts, Weeks 7 to 8
Automate refreshes with scheduled queries, process heavy calculations overnight. Build alert thresholds, notify on five percent week over week MRR drops, payment failure spikes over twenty percent, and churn signals in large accounts. Send weekly summaries with narrative, for example, MRR grew eight percent to fifty two lakh rupees, driven by enterprise expansion. Layer data quality checks, alert on improbable values, zero revenue days, or sudden churn triples.
Building Financial Reporting Dashboards for Compliance
GST Reconciliation Workflows
Start with a GST summary widget, total GST collected, GST paid on expenses, net GST liability, and a simple forecast. Embed reconciliation workflows that compare Chargebee or Razorpay GST totals with bank deposits, flag variances for investigation. Track GST by state, break out CGST, SGST, and IGST for filings and audits. Treat exports correctly, zero rated with proper documentation, monitor LUT status and renewal reminders.
Revenue Recognition Accuracy
Revenue recognition in subscriptions needs precision, recognize annual payments monthly, handle refunds by reversing in the correct period, maintain deferred revenue as a liability with aging, and separate promotional credits and discounts so revenue is not overstated.
Tip: Show billed revenue and recognized revenue side by side, then add drill downs to subscription level schedules.
Audit Ready Reports
Prepare standard packs, revenue by month, customer additions and churn, payment reconciliations, GST summaries, and variance analyses between recognized revenue and bank deposits. Maintain data lineage, track metric derivations and sources, and store monthly snapshots for trend explanations.
Operational Cadence and Decision Making
Daily Revenue Monitoring
Review yesterday’s new MRR, churned MRR, and net change, investigate anomalies quickly. Scan payment failures by method and cause, retry intelligently. Monitor trial conversions and expiring trials, nudge timely with automated emails or sales outreach. Track billing related support tickets, rising volumes often indicate process issues.
Weekly Business Reviews
Study cohort activation and upgrades, probe churn reasons, adjust pricing if value perception is off. Compare sales pipeline with quota and conversion trends, and review cash position to manage delays in collections common in India.
Monthly Deep Dives
Analyze unit economics, LTV to CAC ratio, aim above three, revisit pricing and discount policies, examine expansion revenue triggers, and evaluate channels by CAC and LTV, then reallocate budget to high quality sources.
Common Pitfalls and How to Avoid Them
Data Quality Issues
Standardize customer names, manage currency consistently, separate INR from USD, convert at defined rates, and cleanse payment data so failures and refunds do not inflate revenue. Run weekly audits that compare dashboard outputs with source systems.
Stakeholder Adoption Challenges
Start small with five critical metrics, train users on workflows, collect feedback actively, and make access frictionless, consider email or Slack embeds for summaries. Share success stories so teams see real value.
Technical Debt Accumulation
Document definitions and logic, refactor quick fixes, plan for scale beyond current volumes, and version control changes to aid debugging.
Making Your Dashboard Drive Real Business Impact
From Insights to Action
Add context to every metric, show goal versus actual, prior period, and forecast. Offer recommendations, reduce churn with targeted outreach when payment failures surge, double down on high performing cohorts. Link to next steps, customer lists, support tickets, and payment logs, then track outcomes of interventions to learn what works.
Building a Data Driven Culture
Make metrics visible across the company, connect team work to KPI movement, encourage questions about changes, and share learnings to foster curiosity and improvement.
Continuous Improvement
Monitor dashboard usage, refine high value sections, retire unused views, review metrics quarterly for relevance, benchmark externally, and experiment with new data sources, visualizations, and thresholds, small improvements compound.
Conclusion, Your Next Steps
Do not chase a pretty dashboard, focus on faster and better decisions. Start today with five essential metrics, automate and validate them, then expand. With clear visibility into revenue health, you will prevent crises, capture opportunities early, and answer investor questions confidently, all without scrambling through spreadsheets.
FAQ
How should Indian SaaS treat GST in MRR and ARR reporting, do we show numbers net of GST or gross?
For management reporting, present MRR and ARR net of GST because GST is not revenue, then provide a companion view that shows gross amounts with GST for cash collection context. A practical dashboard shows net revenue as the KPI, gross receipts for cash, and a GST summary widget for liabilities, AI Accountant can automate this separation and reconciliation.
What is the correct approach to revenue recognition for annual subscriptions under Ind AS, how do we operationalize it in dashboards?
Recognize revenue on a straight line basis over the service period, for a twelve lakh rupees annual subscription, recognize one lakh rupees per month, track billed versus recognized revenue, and maintain deferred revenue aging. Dashboards should include subscription level schedules and adjustment logs for refunds or credits, AI Accountant provides recognition schedules that feed directly into BI.
How can we reconcile Razorpay settlements with accounting and GST returns, specifically GSTR 1 and GSTR 3B?
Start with gateway settlement reports by date, match to invoice level data from billing, confirm GST rate application and place of supply, then reconcile to ledger entries. For GSTR 1, validate invoice details, for GSTR 3B, verify outward tax liability versus collected GST. Automate with webhooks into a reconciliation table, then post summaries to accounting, teams often use AI Accountant to generate GST ready exports.
How do we compute CAC inclusive of GST on marketing spends, and allocate common costs correctly?
Add GST on eligible marketing invoices to the spend pool, allocate salaries and overheads for marketing and sales proportionally, then divide by the number of activated paying customers in the cohort. If trials are heavy, use an activation rate adjustment so CAC reflects the true cost per paying customer, the dashboard should show CAC by channel with GST included.
How should we segment churn due to RBI e mandate card failures, and what alerts are appropriate?
Create a churn reason taxonomy that isolates payment failures, sub classify by card type and issuer, then alert when failure rates pass defined thresholds, for example, above twenty percent in a week. Trigger retry workflows and dunning communications automatically, and surface at risk customers to the success team, AI Accountant can tag payment failure churn for downstream analysis.
What payment success benchmarks should we track across UPI, domestic cards, and international cards?
Set target ranges based on observed Indian patterns, UPI near ninety five percent, domestic cards near eighty five percent, international cards near seventy five percent, then track weekly trends, issuer level performance, and authorization versus capture breakdowns. Include alerts for sudden drops and display retry outcomes to improve recovery rates.
How should foreign exchange gains or losses be presented in revenue dashboards for Indian SaaS with USD billing?
Maintain dual views, constant currency growth based on a fixed rate, and reported growth based on actual realized rates. Separate operational revenue from FX remeasurement or realized gains, then provide a bridge that explains the movement. Investors appreciate the clarity, and finance can reconcile to accounting entries smoothly.
What alerts should finance configure to catch recognition and payment anomalies in real time?
Use a small set of focused alerts, five percent week over week MRR drop, payment failures above twenty percent in any method, zero revenue day flags, large customer churn notices, and recognition job failures. Include context and links to drill downs, so responders move from alert to resolution quickly.
How do we create a KPI data dictionary that auditors will accept, and keep it updated?
Document each metric with definition, formula, inclusions and exclusions, source systems, refresh cadence, and responsible owner. Store version history and change logs, and align definitions with accounting policies. Publish internally and review quarterly, tools like AI Accountant can host the dictionary and embed lineage references.
How should deferred revenue aging be set up for subscription businesses, and why does it matter?
Build buckets by remaining service period, under one month, one to three months, three to six months, over six months, and tie each amount to specific contracts. Aging supports cash planning and audit readiness, dashboards should show movements between buckets and link to recognition schedules.
How can CA teams automate revenue reports using BI tools with webhook ingestion, without manual exports?
Stream payment and subscription events via webhooks into a central datastore, normalize with lightweight ETL, then query into Power BI or Data Studio with scheduled refreshes. Add data quality checks and reconciliation tables, and publish role specific views. Many firms use AI Accountant as the ingestion and normalization layer.
What is the right way to calculate LTV with expansion revenue, and account for annual versus monthly retention patterns?
Estimate cohort specific retention curves, include net revenue retention that captures expansion and contraction, and apply gross margin to convert revenue LTV to contribution LTV. Model annual cohorts separately from monthly cohorts because retention dynamics differ, then present LTV alongside CAC by segment.
How should sales commissions be computed when refunds occur mid quarter, and how do we reflect this in dashboards?
Define policy upfront, either claw back commissions on refunded revenue or adjust in the next payout cycle, then implement refund tagging at the invoice level. Dashboards should show commission eligible revenue, adjustments from refunds, and net commissions due, keep a transparent audit trail so finance and sales align on the numbers.

Rohan Sinha is a fintech and growth leader building aiaccountant.com, focused on simplifying accounting and compliance for Indian businesses through automation. An IIT BHU alumnus, he brings hands-on experience across 0 to 1 product building, growth, and strategy in B2B SaaS and fintech.