Key takeaways
- A budget versus actual dashboard is a single view that compares planned spend to recorded reality, flags variances by owner, and answers what happened, why, and who owns the fix, all in one place.
- Clean, standardized data is the foundation. Without accurate actuals flowing from Tally (or similar systems), every variance number is suspect and every review meeting becomes a data debate.
- Design for the five second test: KPI strips, variance tables, and waterfall charts should tell the story instantly, then let users drill through to invoices and journals.
- Governance turns a dashboard into a control system. Freeze data post close, enforce commentary SLAs, track audit trails, and handle Indian GST and TDS reconciliation requirements natively.
- Most teams lose hours each month cleaning bills, normalizing vendor names, and reconciling GST components before any analysis can begin. AI Accountant's bookkeeping automation handles that extraction and categorization work so your team spends time on decisions, not data cleanup.
- Start simple with a five week rollout: connect systems, load history, build core visuals, add commentary workflows, then test and go live. Iterate based on real feedback.
Budget vs Actual Dashboards: What's New in 2026
The biggest shift for Indian finance teams in 2026 is the GST e-invoicing threshold change. Until March 2025, e-invoicing applied to businesses with aggregate turnover above ₹5 crore. From August 2023 onward that dropped to all businesses above ₹5 crore, and the GST portal has been tightening validations throughout 2025. In practice, more SMEs now generate e-invoices, which means more structured data flowing into your actuals feed and tighter reconciliation requirements between your books and GSTR 2B.
For budget vs actual dashboards, this has a concrete workflow impact. Your variance tables must now reconcile against e-invoice reference numbers, not just ledger entries. ITC claims rejected due to mismatched IRNs show up as cash flow variances that did not exist two years ago. CA firms managing ten or more GSTINs across states need automated matching to keep month end close under five days.
The cost of ignoring this: blocked ITC, interest at 18% on delayed GST payments per CBIC circulars, and compliance flags during audits. Firms still reconciling GST manually in spreadsheets are spending three to five extra days per entity each month.
What to do now:
- Audit your current GST reconciliation workflow against GSTR 2B for every active GSTIN before your next quarterly close.
- Ensure your dashboard data model captures IRN references and e-invoice status alongside standard GL data.
- Automate vendor bill matching so that invoice level mismatches surface as dashboard alerts, not audit findings.
Teams using automated GST reconciliation can flag mismatches within hours of the GSTR 2B release rather than discovering them weeks later during manual review.
Table of contents
What makes a budget vs actual dashboard essential
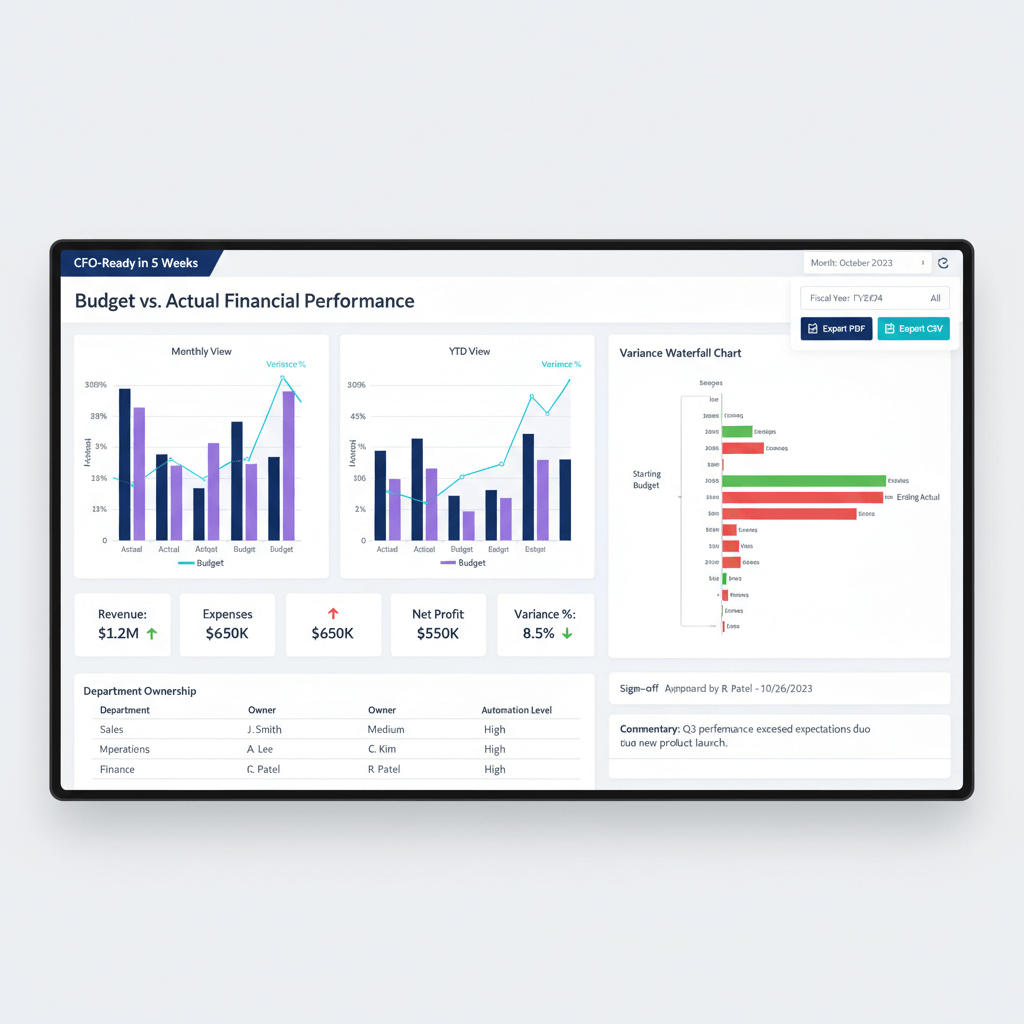
A budget versus actual dashboard goes beyond a standard P&L. It integrates time intelligence, ownership mapping, and actionable commentary to answer three critical questions: what happened, why did it happen, who owns the fix.
Think of it as your financial control tower. You spot overspends before they spiral. You trigger reforecasts when trends shift. You create accountability by linking every variance to an owner.
No more debates in meetings about whose numbers are right. The dashboard is the single source of truth.
Your dashboard needs four data pillars to work properly:
- Budgets must be versioned by account, cost center, and month. Track original and revised versions separately.
- Actuals flow from your accounting system like Zoho Books or Tally. Ensure proper chart of accounts alignment, cost center tags, project codes, and normalized GST and TDS data.
- Master data includes chart of accounts (COA), cost center hierarchy, owner mappings, and grouping rules.
- Calendar logic enables MTD, YTD, and rolling twelve month views. It handles fiscal year boundaries and seasonal patterns.
When these pillars are solid, your budget versus actual analysis becomes reliable. When any pillar is weak, every number downstream is suspect.
Core components every dashboard needs
Monthly and YTD toggle views
Your dashboard should switch between MTD, QTD, YTD, and rolling twelve month views with one click. Add prior year comparisons for context. Use sparklines to show trends. Deploy heatmaps with RAG flags to highlight problem areas instantly.
The best dashboards feel intuitive. A marketing head should see monthly spend trend immediately. The CFO should spot cash flow patterns without hunting.
Design for the five second test. If someone cannot understand the main message quickly, simplify.
Variance types and thresholds
Show variances both as absolute amounts and percentages. Mark favorable in green and unfavorable in red.
Set intelligent thresholds that trigger alerts. For example, five percent variance on payroll may be acceptable. Ten percent on discretionary spend should trigger review. Different ledger accounts need different sensitivity. Build these nuances into your threshold logic.
Combine percentage and absolute value rules to avoid alert noise. A ₹500 variance that is 20% of a small line item should not get the same attention as a ₹5 lakh variance that is 8% of a large one.
Building variance waterfall charts
A variance waterfall steps users from budget to actual. It shows each driver along the way.
Start with the budget amount. Add favorable variances as positive bars. Subtract unfavorable as negative bars. End at the actual amount.
Order matters. For costs, show volume impact first, then rate changes. For revenue, lead with price changes, then volume.
Example: marketing opex starts at ten lakhs budget. Campaign volume drove two lakh unfavorable variance. Vendor rate increases added another one lakh unfavorable. You end at thirteen lakhs actual.
The waterfall makes the story clear. The drill through makes it actionable. Click a rate variance to see which vendors increased rates. Click again to see individual invoices.
Waterfall charts work especially well for non finance stakeholders. They turn abstract numbers into a visual narrative that anyone can follow.
Implementing responsibility mapping
Every variance needs an owner. Map cost centers to department heads, then assign specific GL accounts (ledger entries) to owners.
Use RACI for shared responsibility. Set SLAs for commentary. For example, explanations due within forty eight hours for variances over ten percent.
Build an owner directory with primary and backup contacts. Set automated alerts when variances breach thresholds. For multi entity setups common with CA firms, use role based access so each office sees only appropriate data.
Make ownership visible on the dashboard itself. When a variance has no name next to it, nobody feels accountable. When it does, action happens faster.
Commentary and digital sign off workflows
Structure commentary with a standard format: what happened, why, what action will fix it, who owns it, when will it complete.
Carry forward open actions. Link actions to outcomes. Build the commentary repository into the dashboard or link to a structured sheet.
Enable digital sign offs for audit trails. Timestamp approvals. Lock content post close.
Set cadence:
- Mid month checkpoints catch issues early.
- Month end close includes full commentary.
- Quarterly sessions rebaseline budgets when necessary.
- Variances over twenty percent should trigger immediate reforecast discussions.
Creating professional PDF exports
Boards and investors want clean PDF packs. Start with a cover page showing report period and preparer. Add a linked table of contents. Include an executive summary highlighting key variances and actions.
Create standardized layouts for each department. Keep chart aspect ratios consistent. Test on different devices.
Use filters and bookmarks to tailor packs. Build saved views rather than manual recreations. Schedule automated exports post close. Set secure distribution lists. Use clear version naming. Archive and retain accessibility for YoY comparisons.
A well designed PDF export eliminates the last mile problem where great dashboard analysis gets lost in ugly, inconsistent board packs.
Data architecture for Zoho Books and Tally integration
Design your data model for Indian accounting. Implement bidirectional sync between your accounting system and dashboard platform. Pull COA, cost centers, vendors, and customers. Push budget uploads back.
Explore Tally integration with AI Accountant for robust data pipelines that keep your actuals feed clean and current.
Loading budget data
Create Excel templates with validations. Include dropdowns for cost centers and GL accounts. Add formula checks for balanced uploads.
Support versioning to track original versus revised budgets. Implement maker checker workflows so no single person can alter budget baselines without review.
Syncing clean actuals
Raw accounting data is messy. Bills vary in format. Bank statements need parsing. GST classifications might be off. Automation helps:
- AI Accountant automates bill extraction, transaction categorization (mapping transactions to GL accounts and cost centers), and GST reconciliation, with direct Tally integration.
- QuickBooks offers automated bank feeds and basic categorization rules.
- Xero provides bank reconciliation and invoice scanning features.
- FreshBooks includes expense tracking and basic automation workflows.
- Zoho Books has built in automation rules for recurring transactions.
AI Accountant handles OCR for vendor invoices, normalizes vendor names, and reconciles GST components including CGST, SGST, IGST, and RCM scenarios. The cleaned data flows seamlessly into your dashboard.
Building mapping tables
Create lookup tables for COA groupings, cost center to owner mappings, vendor normalization, GST reconciliation rules, and TDS sections with GL accounts and rates.
Build a calendar table with fiscal markers, month end dates, and week definitions. Indian companies often use April to March fiscal year. Align YTD logic accordingly.
These mapping tables are the glue between your accounting system and your dashboard. Invest time here and everything downstream becomes easier. According to ICAI guidelines, maintaining a standardized chart of accounts is a fundamental requirement for accurate financial reporting.
Step by step implementation guide
Week 1: connect and sync systems
Connect Tally (or Zoho Books) to AI Accountant for data cleaning. Set bidirectional sync for masters like COA and cost centers. Align account codes. Map custom fields. Test with sample transactions.
Document mappings in a spreadsheet for audits and onboarding.
Week 2: load historical data
Import last year actuals for YoY comparisons. Load current year budgets using validated templates. Set up versioning.
Clean historical data for consistency. Decide whether to back tag missing cost center transactions or exclude them from certain analyses.
Week 3: build core visualizations
Start with summary KPIs: revenue, gross margin, operating expenses, EBITDA. Add sparklines for twelve month trends.
Create a variance table showing budget, actual, variance amount, and variance percent. Build waterfalls for total revenue and expenses, then material lines like payroll or marketing. Add filters for time, department, cost center, and project.
Week 4: add advanced features
Implement commentary fields. Set digital sign offs. Create alert rules for threshold breaches.
Build role based access. Design PDF templates. Test export combinations. Verify charts render correctly. Schedule automated distribution.
Week 5: testing and training
Run parallel reporting for one month. Reconcile discrepancies. Train users on navigation, filtering, and commentary.
Prepare quick reference guides. Document refresh schedules and responsibilities.
Go live and iterate
Launch with a pilot group. Gather feedback. Refine based on usage, then roll out.
Schedule weekly reviews initially. Prioritize changes that improve accuracy or save time. The goal is a dashboard that people actually use, not one that sits untouched after launch.
Governance controls and audit requirements
Data freeze protocols
Lock actuals after close. Disallow backdated entries without approval and documentation. Maintain budget version control with change logs. Archive month end dashboard snapshots.
A frozen baseline ensures that variance analysis stays meaningful. Without it, numbers shift under your feet and nobody trusts the dashboard.
Access logs and audit trails
Track edits to mappings, budgets, and commentary. Log who accessed which reports and when.
For CA firms managing multiple clients, maintain strict data segregation with role based access. This is both a governance best practice and a regulatory expectation under MCA compliance requirements.
Indian regulatory specifics
Handle GST reconciliation between books and GSTR 2B. Track input tax credit (ITC). Manage multiple GSTINs across states. Reconcile TDS with Form 26AS on the Income Tax portal.
Build distinct views for statutory versus management reporting. Statutory views must align with GST return formats. Management views should focus on decision relevant groupings.
Common problems and practical solutions
Misaligned chart of accounts
Standardize COA before implementation. Create mapping tables for unavoidable differences. Document reasons. Review quarterly.
This is the most common reason dashboards show incorrect variances. Fix it first.
Missing cost center tags
Set validation rules requiring cost center selection. Use auto categorization to suggest tags. Review untagged transactions weekly.
Even a small percentage of untagged transactions can distort department level variance analysis significantly.
Dashboard information overload
Create hierarchical navigation: executive summary first, then department drill downs, then transaction detail. Keep consistent layouts across all levels.
The best budget versus actual dashboard is one that people open daily, not one that overwhelms them into avoidance.
Unclear ownership
Define RACI matrix upfront. Assign primary and backup owners. Set SLAs for commentary. Escalate unaddressed variances automatically. Make ownership visible on every variance line.
PDF export breaking
Design with fixed aspect ratios. Test exports across data volumes and devices. Build separate PDF optimized views if needed.
A broken PDF in a board pack undermines credibility for the entire finance team. Test thoroughly before go live.
Templates and quick start resources
Dashboard layout template
Proven structure:
- Header: report title, period selector, last refresh timestamp, key filters.
- KPI strip: four to six metrics with sparklines and YoY change.
- Variance summary: budget, actual, variance, variance percent, owner.
- Waterfalls: revenue and expense variance drivers.
- Detailed tabs: one per department.
- Commentary panel: structured explanations and actions.
Power BI DAX formulas
Variance calculation:
Variance = SUM(Actuals[Amount]) - SUM(Budget[Amount])
Variance percentage:
Variance% = DIVIDE([Variance], SUM(Budget[Amount]), 0)
YTD calculations:
YTD_Actuals = CALCULATE(SUM(Actuals[Amount]), DATESYTD(Calendar[Date]))
Implementation checklist
Data preparation phase:
- Connect accounting systems.
- Map COA and cost centers.
- Load historical data.
- Set refresh schedules.
Dashboard development:
- Build data model.
- Create visualizations.
- Add filters and drill through.
- Design navigation.
Process implementation:
- Define ownership matrix.
- Set commentary templates.
- Configure alerts.
- Create sign off workflow.
Testing and training:
- Validate calculations.
- Test scenarios.
- Train end users.
- Document procedures.
Go live:
- Run parallel for one month.
- Daily monitoring first week.
- Weekly reviews first month.
- Monthly optimization ongoing.
Making your dashboard deliver results
A great budget vs actual dashboard transforms performance management. It cuts close time. It eliminates data debates. It creates accountability by linking every variance to an owner.
Most importantly, it enables quick course corrections before small problems become big ones.
The key is clean, reliable data. When your actuals feed is automated and your GST reconciliation runs without manual intervention, teams spend time on analysis instead of cleanup.
Dashboards are living tools. Keep refining based on feedback. Start simple, get the basics right, then add advanced features as you mature.
Soon, you will wonder how you managed without a proper budget versus actual dashboard.
FAQ
How should a CA configure revised budgets mid year without losing audit traceability?
Use budget versioning with immutable originals. Create a revision workflow requiring maker checker approvals and reason codes. Display variance versus revised by default with a toggle to original. Store change logs and timestamps so auditors can trace every revision back to its source and approver.
What is the practical difference between budget vs forecast vs actual in monthly governance?
Budget is the annual plan, forecast is the rolling outlook updated monthly or quarterly, and actual is recorded reality. Early months focus on budget vs actual to test assumptions. Later months emphasize forecast vs actual for steering decisions. A mature setup shows both lenses: budget vs actual for board reporting and forecast vs actual for operational reviews.
How can a CA manage owners who handle multiple cost centers across entities?
Create consolidated owner views that aggregate variances across cost centers, then allow drill down to individual centers. Configure alerts at both consolidated and granular levels. Document shared responsibility via RACI so escalation paths are clear when a variance falls between two departments.
What thresholds should trigger automated variance alerts, and how should they differ by account type?
Set account specific sensitivity: one percent on rent, five percent on payroll, fifteen percent on discretionary marketing spend. Add absolute value floors (for example, alert only when variance exceeds five percent and ₹5 lakhs) to avoid noise from small line items. Review and adjust thresholds quarterly as your business scales.
How can a CA ensure GST and TDS reconciliation is reflected in cash flow variances?
Integrate GST reconciliation against GSTR 2B and track ITC utilization timing. Reconcile TDS with Form 26AS on the Income Tax portal. Map reconciled tax entries to cash flow dashboards so timing differences between accrual and actual tax payments are visible as explainable variances, not mysteries. With e-invoicing now mandatory for more businesses, ensure IRN references are captured in your data model (2026 update).
What data model structure best supports Tally for monthly and YTD reporting?
A star schema works best: fact tables for actuals and budgets, dimension tables for calendar, COA, cost centers, projects, vendors, and owners. Include a robust calendar dimension with fiscal markers for April to March. Support versioning in budget facts so original and revised plans coexist without overwriting each other.
What is the recommended cadence for variance governance across the month?
Run mid month checkpoints for early warning, full month end reviews with structured commentary, and quarterly rebaselining sessions. For variances exceeding twenty percent of budget, trigger immediate reforecast discussions rather than waiting for the next scheduled review. Enforce forty eight hour SLAs for owner responses to flagged variances.

Rohan Sinha is a fintech and growth leader building aiaccountant.com, focused on simplifying accounting and compliance for Indian businesses through automation. An IIT BHU alumnus, he brings hands-on experience across 0 to 1 product building, growth, and strategy in B2B SaaS and fintech.