Key takeaways
- A break even analysis dashboard India shows the exact point where your revenue covers all costs, giving you a clear view of contribution per unit, contribution margin, and margin of safety so you can make pricing and volume decisions with confidence.
- The four core components to build are Fixed Cost Tracking, a Variable Cost Dashboard, Contribution Analysis Tools, and a Margin of Safety Calculator, each tailored for Indian cost structures including GST, MDR, and marketplace fees.
- Structure your data cleanly in Tally by tagging fixed versus variable costs, mapping SKUs to segments, and excluding GST from revenue. Dashboard accuracy depends entirely on data quality.
- If your margin of safety drops below 30%, act immediately: reprice, prune loss making products, or renegotiate variable costs before the next quarter begins.
- Stale dashboards lead to stale decisions. Teams that automate bank statement ingestion and GST reconciliation through platforms like AI Accountant cut dashboard prep time by up to 80%, freeing CAs and finance teams to focus on analysis instead of data entry.
Break Even Dashboards for Indian SMEs: What's New in 2026
The biggest shift for break even dashboards in 2026 is the tightened GST compliance environment. Until March 2025, e-invoicing applied to businesses with turnover above ₹5 crore. From April 2025, CBIC extended the mandate to businesses with turnover above ₹1 crore, as outlined in CBIC notifications. This pulls a much larger pool of SMEs into real time invoice reporting. For break even dashboards, it means your variable cost data now flows through a stricter validation layer, and any mismatch between your e-invoices and GSTR filings can block ITC claims.
The operational shift is tangible. Finance teams must now reconcile e-invoice reference numbers (IRN) against GSTR 2B before computing net variable costs. If your input credits are disallowed due to mismatches, your effective variable cost per unit rises, pushing your break even point higher without any change in pricing or volume. Businesses on Tally need to ensure their e-invoicing module is configured to capture IRN data and feed it cleanly into cost dashboards.
Who does this hit hardest? SMEs in the ₹1 crore to ₹10 crore turnover band, especially D2C brands and small manufacturers who previously managed compliance manually. The cost of inaction is concrete: unreconciled ITC worth even ₹50,000 per month inflates your BEP by hundreds of units. Penalties under Section 122 of the CGST Act can reach ₹25,000 per instance for e-invoicing non compliance, per the GST portal.
What to do now:
- Audit your e-invoicing setup in Tally before your next GST filing cycle.
- Add an ITC reconciliation check as a data validation step before your BEP dashboard refreshes.
- Review your variable cost assumptions quarterly to account for any disallowed credits.
Teams already using automated vendor bill matching can flag these mismatches before they distort break even numbers.
Understanding Break Even Analysis Fundamentals
Your break even point (BEP) is where total revenue equals total costs. No profit, no loss.
Fixed costs stay constant regardless of sales volume: rent, salaries, insurance. Variable costs move with units sold: raw materials, shipping charges, MDR fees.
Contribution per unit equals selling price minus variable cost per unit. This shows how much each unit contributes to covering fixed costs. Contribution margin ratio equals contribution per unit divided by selling price, multiplied by 100.
BEP in units = Fixed costs ÷ Contribution per unit
BEP in revenue = Fixed costs ÷ Contribution margin ratio
Example: fixed costs ₹5,00,000 monthly, selling price ₹500, variable cost ₹300. Contribution per unit is ₹200. Margin ratio is 40%. BEP is 2,500 units. BEP revenue is ₹12,50,000.
Use these numbers to price products, set monthly targets, prune unprofitable SKUs, and plan runway. The formulas are simple. The discipline of applying them consistently is what separates profitable businesses from those guessing their way forward.
For deeper fundamentals, explore the ICAI guidance on cost accounting standards and the break even frameworks used in management accounting.
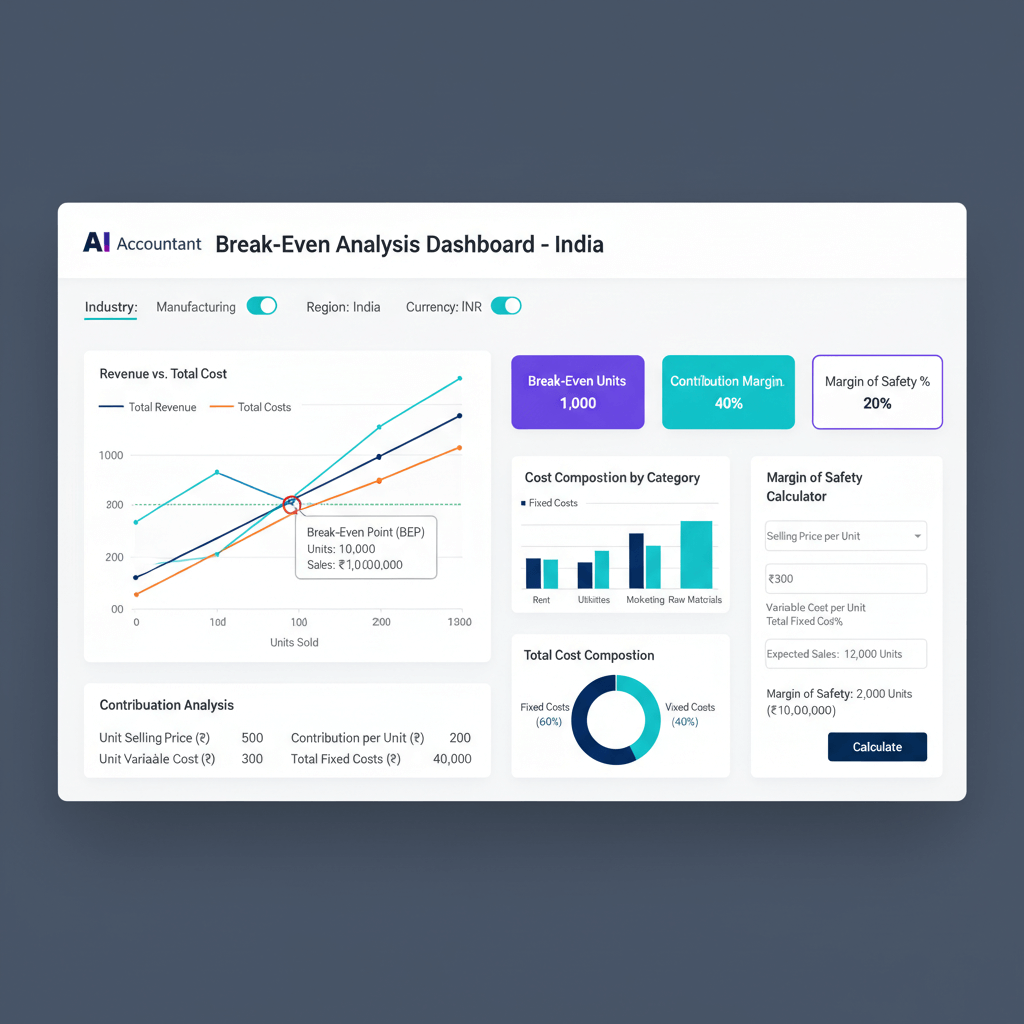
Essential Components of a Break Even Analysis Dashboard India
Your dashboard should drive decisions, not just look pretty. Track BEP in units and revenue, contribution margin percentage, margin of safety (the buffer above break even), and target versus actual performance.
- Use a cost revenue line chart. The intersection shows BEP.
- Add contribution waterfalls by product or customer segment.
- Include a donut chart for the fixed versus variable cost split.
Each widget should deliver clear value:
Fixed Cost Tracking monitors month to date spend versus budget. It shows three month trends and alerts on jumps like rent increases. It tracks salaries, SaaS subscriptions, and depreciation in Indian contexts.
Variable Cost Dashboard displays SKU wise unit economics and channel mix. It breaks down raw materials, freight, MDR fees, and captures GST input credits. It also accounts for UPI fees, TCS, and TDS deductions unique to Indian businesses.
Contribution Analysis Tools reveal profitability by product, channel, and customer segment. They highlight your top 10 performers and loss makers. They also account for marketplace commissions and channel mix variations common in Indian ecommerce.
Margin of Safety Calculator shows units and revenue buffer above break even. It runs scenarios for price and cost changes. It models fuel surcharges and GST rate modifications relevant to Indian operations.
Setting Up Your Data Structure with Tally
Your data quality determines dashboard accuracy. Most Indian SMEs use Tally.
Structure sales data with product name, quantity, net price after discounts, and GST recorded separately. Tag costs as fixed or variable immediately. Note cost drivers like per unit, percentage of sales, or per shipment.
Map SKUs to product categories. Link customers to segments. Connect vendors to cost types. Assign general ledger codes. This mapping enables meaningful contribution analysis tools later.
Avoid common pitfalls:
- Do not include GST in revenue or costs for BEP calculations.
- Handle credit notes and debit notes on time.
- Clarify semi variable costs like overtime or electricity.
Set cost centers for fixed expenses and item wise tracking for variables. Use cost categories in Tally.
Document your classification rules clearly: how you split electricity, handle step fixed costs, and categorize mixed expenses. Consistent rules produce reliable dashboards.
Building Your Break Even Dashboard Step by Step
Build using Excel, Google Sheets, or Power BI. Start with 6 to 12 months of ledger data from Tally.
Step 1: Data Extraction and Preparation
Export your sales register, purchase register, expenses ledger, and chart of accounts. Include full transaction level details. Ensure ledger entries are tagged with cost center and category information.
Step 2: Cost Classification
Create a fixed costs table: rent ₹1,00,000 monthly, salaries ₹3,00,000, insurance ₹20,000. Sum these for total monthly fixed costs.
Create a variable costs table: COGS ₹200 per unit, shipping ₹50 per unit, payment gateway 2% of sales. Calculate variable cost per unit. Include vendor invoice charges and marketplace deductions where applicable.
Step 3: Unit Economics Calculation
Contribution per unit equals net selling price minus total variable cost per unit. If you sell at ₹900 net and variables total ₹618, contribution equals ₹282.
Contribution margin percentage equals contribution divided by net selling price. Here, that is 31.3%.
Step 4: Break Even Point Computation
BEP units equals fixed costs divided by contribution per unit. BEP revenue equals fixed costs divided by contribution margin percentage.
With ₹3,00,000 fixed costs and ₹282 contribution, you need 1,064 units and revenue of ₹9,57,600.
Step 5: Margin of Safety Calculator Setup
MOS units equals actual sales minus BEP units. If 2,000 units sold against 1,064 BEP, MOS equals 936 units. MOS percentage equals 936 divided by 2,000, which is 47%.
Add what if scenarios: price changes of plus or minus 10%, cost variations of plus or minus 5%.
Step 6: Contribution Analysis Tools Configuration
Build pivots by product, channel, and customer. Sort by total contribution. Identify profit drivers and drains.
Run ABC analysis. Rank products by cumulative contribution. Find the 20% that drive 80% of profits.
Step 7: Dashboard Visualization
Design a line chart with revenue and cost lines. Mark the intersection as BEP.
Add a contribution waterfall: revenue minus variable costs yields contribution, then deduct fixed costs to show profit or loss.
Include a donut chart for fixed versus variable split. Add a margin of safety gauge. For automation, connect Power BI to your accounting system. Set auto refresh daily or weekly.
Automating Dashboard Updates with Modern Tools
Automation keeps your break even analysis dashboard India alive. Evaluate tools that understand GST, TDS, and marketplace settlements.
- AI Accountant: Extracts vendor bills and invoices for your variable cost dashboard, syncs with Tally, maps fixed versus variable using AI, processes bank and credit card statements for MDR and fees, handles GST reconciliation. With 300M+ transactions processed and ISO 27001 and SOC 2 Type II certification, it can reduce prep time by 80%.
- QuickBooks Online: Built in reporting and templates for break even analysis. Integrates with Indian payment gateways and supports GST. Limited for complex contribution analysis.
- Xero: Cash flow and profitability reports with a strong API for custom dashboards. Multi currency support for exporters. Needs add ons for advanced analytics.
- FreshBooks: Simple for service businesses. Basic profitability tracking. Good for freelancers but limited for manufacturing cost tracking.
- Tally Prime with TDL Customization: Deep Indian compliance support. Customizable reports via TDL. Complex inventory costing. Requires technical expertise for advanced dashboards.
Choose tools that integrate with Tally. Let clean data flow into contribution analysis tools and your margin of safety calculator.
India Specific Considerations for Accurate Break Even Analysis
GST Handling
Exclude output GST from revenue. Include only base price in contribution calculations. Net input credits against costs. Reconcile monthly to avoid GSTR 2A and 2B mismatches. Refer to the GST portal for the latest return filing guidelines and credit matching rules.
Marketplace Dynamics
Amazon and Flipkart settlements include commissions, advertising charges, storage fees, and return deductions. Factor in settlement cycles. Cash collection delays can mask whether you have actually crossed break even.
D2C Considerations
MDR varies by payment method: UPI versus cards versus net banking. COD adds collection charges and return to origin (RTO) costs. Build weighted averages. Model RTO rates and shipping slabs in your variable cost dashboard.
Manufacturing Nuances
Split power into fixed base load versus variable consumption. Include scrap and wastage in your bill of materials. Track capacity utilization seasonally.
Service Business Adaptations
Define your unit clearly: per hour, per project, or per seat. Include bench costs and utilization rates. A CA firm, for example, might define the unit as a billable hour per associate.
Seasonal Adjustments
Calculate monthly BEP rather than annual averages. Build working capital buffers for lean months. Indian businesses often see seasonal swings around Diwali, year end closings, and monsoon slowdowns. The RBI's periodic bulletins on economic activity can help you benchmark seasonal patterns.
Interpreting Results and Taking Action
Reading the Signals
Falling contribution margin implies rising costs or excessive discounting. Rising fixed costs signal inefficiency. Low margin of safety warns of risk. Negative contribution products drain profits every time you sell one.
Strategic Playbooks
Test price elasticity on a single channel first. Prune negative contributors unless they drive profitable upsells. Build volume buffers of at least 30% above break even. Model inflation quarterly.
Channel Optimization
Compare contribution by channel using contribution analysis tools. Shift spend toward higher margin channels while balancing volume tradeoffs. Many Indian D2C brands find website orders outperform marketplace orders by ₹50 to ₹80 in contribution per unit.
Product Mix Decisions
Rank by total contribution, not only margin percentage. Allocate resources to heroes, fix or eliminate underperformers, and experiment with new launches in small batches.
Capacity Planning
Use your margin of safety calculator to time expansion. Model step fixed costs carefully. Adding a second shift or warehouse might double capacity but could push your BEP up by 30% until volume catches up.
Worked Example: D2C Apparel Brand in India
The Setup
Listed price ₹1,000, typical discount 10%, net ₹900.
Variable Costs Breakdown
Fabric ₹300, tailoring ₹200, packaging and shipping ₹100 (including returns), payment gateway MDR 2% equals ₹18. Total variable cost per unit: ₹618.
Fixed Costs Monthly
Rent ₹50,000, salaries ₹2,00,000, marketing retainer ₹30,000, overheads ₹20,000. Total: ₹3,00,000.
Break Even Calculation
Contribution equals ₹900 minus ₹618 equals ₹282. Margin: 31.3%. BEP units: ₹3,00,000 divided by ₹282 equals 1,064. BEP revenue: ₹9,57,600.
Actual Performance
2,000 units sold. Revenue ₹18,00,000. Variable costs ₹12,36,000. Contribution ₹5,64,000. Profit after fixed costs: ₹2,64,000.
Margin of Safety Analysis
MOS units equals 936. MOS percentage equals 47%. The variable cost dashboard flags shipping at ₹120 per unit versus ₹100 budget.
Channel Investigation
Contribution analysis tools show marketplace orders at ₹250 contribution and website orders at ₹310. Marketplace returns and COD collection charges drive the gap.
Corrective Actions
Push website traffic. Offer a 5% prepaid discount. Negotiate shipping rates. Recalculate BEP at 1,150 units. MOS drops to 43%, still healthy.
Scenario Planning
If cotton rises 15%, fabric jumps to ₹345. Contribution drops to ₹237. BEP jumps to 1,266 units. Test a 5% price increase to ₹945 on your website first, then iterate based on conversion data.
Common Mistakes to Avoid
GST Inclusive Calculations
Do not include GST in selling price for analysis. Separate input GST from costs. This is one of the most common errors CA firms flag during reviews.
Misclassifying Semi Variables
Split electricity into basic charges (fixed) and usage (variable). Clarify overtime structures. Document the split rule so it is consistent month to month.
Ignoring Returns Impact
Adjust variable costs upward for shipping both ways. Returns reduce net units and contribution. For D2C brands, RTO can inflate effective variable costs by 5% to 10%.
Using Average Costs for Tiered Pricing
Build cost tables for volume slabs. Reflect actual costs in your variable cost dashboard. Using averages hides the true economics of each pricing tier.
Keeping Fixed Costs Static After Scale
Identify step fixed costs as you grow. Model their impact on BEP before you commit to expansion.
Missing Hidden Variable Costs
Include charge backs and retries for MDR. Include sponsored ads, storage fees, and penalties for marketplaces. These "hidden" costs can shift your break even point by hundreds of units. The Economic Times regularly covers marketplace fee changes that affect seller economics.
FAQ
How do I compute BEP units when contribution margin fluctuates month to month due to discounts?
Compute contribution per unit for each month using net price after discounts, minus variable cost per unit, then divide fixed costs by that month's contribution. If discounts vary by channel, compute separate BEPs by channel and show weighted averages on your dashboard. This prevents a single blended number from hiding channel level problems.
How should a CA classify semi variable costs like electricity in Tally for accurate break even?
Create two ledgers or cost categories: electricity base charge under fixed, and production consumption under variable. Allocate based on metered usage or engineering estimates. Document the rule, apply it consistently, and use cost centers to link each portion to the correct department.
What is the correct approach to exclude GST from revenue and costs in BEP?
Record only the base price (excluding output GST) as revenue, and reduce costs by claimable input GST credits. Reconcile GSTR 2A and 2B monthly, and pass adjustment entries for mismatches before publishing your dashboard. From FY 2025 onwards, businesses above ₹1 crore turnover must also validate e-invoice IRN data against GSTR 2B before confirming input credits (2026 update).
How can I model step fixed costs, for example adding a second warehouse or a new shift?
Build capacity steps by defining the volume threshold where fixed costs jump, then compute a new BEP at each step. For example, adding a shift might increase fixed costs by 30% but double capacity. Run scenario BEP at both the old and new states and compare margin of safety before committing capital.
What margin of safety percentage should Indian SMEs target as a risk buffer?
Target 30% to 40% MOS for volatile sectors like D2C or seasonal manufacturing, and at least 20% for stable service businesses. MOS percentage equals actual units minus BEP units, divided by actual units. Track it by channel and product to guide discount budgets and inventory planning.
How do I handle COD returns and RTO in contribution analysis for D2C brands?
Treat RTO related shipping and handling as variable costs. Compute an effective variable cost per successful delivery by adding the average cost of failed deliveries spread over successful units. This adjustment typically reduces contribution by 5% to 10%. Update your BEP accordingly each month.
Which tools are practical for Indian SMEs to build and maintain a break even dashboard?
Start with Excel or Google Sheets for 3 to 6 months of data. Once manual updates become a bottleneck, connect to Power BI and automate refresh cycles. If GST reconciliation, MDR parsing, and bank statement processing consume significant time, adopt automation tools that integrate with Tally to keep dashboards current and reduce prep work.
Taking Your Break Even Analysis Forward
Building a break even analysis dashboard India transforms how you make decisions. Start in Excel. Get comfortable with contribution thinking. Add fixed cost tracking and a variable cost dashboard gradually.
Upgrade to automation when manual updates start hurting accuracy. Connect Tally and let systems handle the repetitive work while you focus on insights.
Use contribution analysis tools monthly to spot trends early. Run your margin of safety calculator before major decisions. Test scenarios before committing capital or signing new leases.
Download our free Excel template to get started. It includes a fixed costs tab, variable cost layout, contribution pivots, and a margin of safety calculator.
For teams on Tally, explore automation options. Clean data delivers accurate insights. Better insights drive stronger businesses. Your break even analysis dashboard India becomes a compass: it shows where you are, where you are headed, and what adjustments keep you on track. Build it right, maintain it well, and let data guide your growth.

Rohan Sinha is a fintech and growth leader building aiaccountant.com, focused on simplifying accounting and compliance for Indian businesses through automation. An IIT BHU alumnus, he brings hands-on experience across 0 to 1 product building, growth, and strategy in B2B SaaS and fintech.