Key takeaways
Why financial performance analysis matters
Financial performance analysis links strategy, operations, and finance into one clear view, so leaders answer practical questions with confidence, not guesswork. Are we profitable, do we have enough cash, where are we leaking money, what should we fix first. Monthly analysis turns financials into a steering wheel.
Basic bookkeeping records history, statutory audits ensure compliance, analysis is about decisions on pricing, cost, cash, growth, and risk. It is also how you get investor ready, and align GST and TDS with real cash flows. See overviews at Mozon Tech, CFI, and Indeed.
Clean books first, analysis second, action always.
Financial statements and data readiness
Strong analysis starts with data hygiene and a timely close. Work on an accrual basis so revenue and costs match the right period, cash basis can hide true margins and working capital strain.
Do monthly reconciliations, bank, accounts receivable, accounts payable, GST, TDS, and lock your books. Build a simple MIS pack with key KPIs and schedules, or draw from the guidance at CFI and Aviana Global.
Horizontal analysis and vertical analysis
Use two lenses for fast clarity, drawing on approaches summarized by Indeed and CFI.
Combine both, pattern and proportion reveal where structure is healthy, and where it needs work.
Example: Vertical analysis shows customer support costs rising faster than revenue, horizontal analysis confirms a three month trend, cue a deep dive on ticket volumes and product quality.
Ratio analysis and DuPont analysis
Ratios pack signal into simple numbers, see curated lists at Aviana Global and CFI.
DuPont analysis decomposes ROE into profit margin, asset turnover, and financial leverage. This tells you whether ROE moved because of margins, utilization, or leverage, and therefore where to act.
Track ratios monthly, review drivers quarterly, wire the drivers into your forecast.
Variance analysis, benchmarking, and cohort analysis
Variance analysis compares actuals to plan, explaining gaps by timing, quantity, price, or mix, then assigning actions. Benchmarking adds context against peers or targets, see CFI. Cohort and segment analysis breaks performance by product, channel, customer type, or region so you see where you truly earn returns.
Profitability metrics and interpretation
Choose margins that match your model, and use common size views for clarity. References, Citrin Cooperman, Klipfolio, and HBS Online.
Always check non cash items, depreciation can distort comparisons. If operating margin compresses while EBITDA margin is steady, suspect rising non cash charges, or a shift in capitalization policy.
A dedicated profitability analysis dashboard for SMBs makes these trends easier to spot by combining margins, cost drivers, and revenue performance into a single view. Instead of reviewing reports in isolation, teams can monitor profitability continuously and act before small issues become larger financial problems.
Liquidity metrics and solvency metrics
Liquidity is near term capacity to pay, solvency is long term safety. See benchmarks at CFI and Citrin Cooperman.
Leverage amplifies outcomes, keep buffers for shocks.
Efficiency metrics and cash conversion
Working capital efficiency frees cash without new funding. Guidance at Citrin Cooperman.
Improve CCC by reducing slow moving inventory, accelerating collections, and negotiating fair supplier terms.
Growth metrics and unit economics
Growth needs discipline. Product businesses track revenue growth and average ticket size, subscriptions track MRR or ARR and net revenue retention, see examples at Klipfolio and Citrin Cooperman.
Grow what pays back fast, pause what does not.
Cash flow analysis and runway
Cash is the life of the business. Use the indirect method, start with net income, add back non cash items, adjust for working capital changes. Pre profit teams should track burn and runway, see a primer at AI Accountant, cash flow and runway.
Levers to improve cash, speed collections, extend payables where fair, optimize inventory and prepayments.
Budgeting and forecasting
Translate strategy into numbers, and update continuously, see AI Accountant, forecasting services.
Keep a rolling twelve month forecast, refresh monthly. Know your break even, fixed costs divided by contribution per unit, then test price and volume assumptions.
Translating insights into actions
Numbers matter only when they drive change, tie each insight to an action, an owner, and a date.
Review impact next month, close the loop, and keep compounding improvements.
Monthly playbook for financial performance analysis
Set governance, monthly review, quarterly strategy check, annual reset. Use simple checklists and trackers, see reference frameworks at Mozon Tech, Aviana Global, and Klipfolio.
Common pitfalls in financial performance analysis
Build checks into your monthly process so errors do not snowball, see guidance at CFI, Indeed, and Citrin Cooperman.
Technology and dashboards for financial performance analysis
A modern dashboard is your live control panel, integrating banks and systems, offering trend lines, drill downs, alerts, and an audit trail. Read a detailed guide at AI Accountant, real time dashboards.
Tools to explore, choose what fits your scale and workflow.
AI Accountant virtual accounting for financial performance analysis
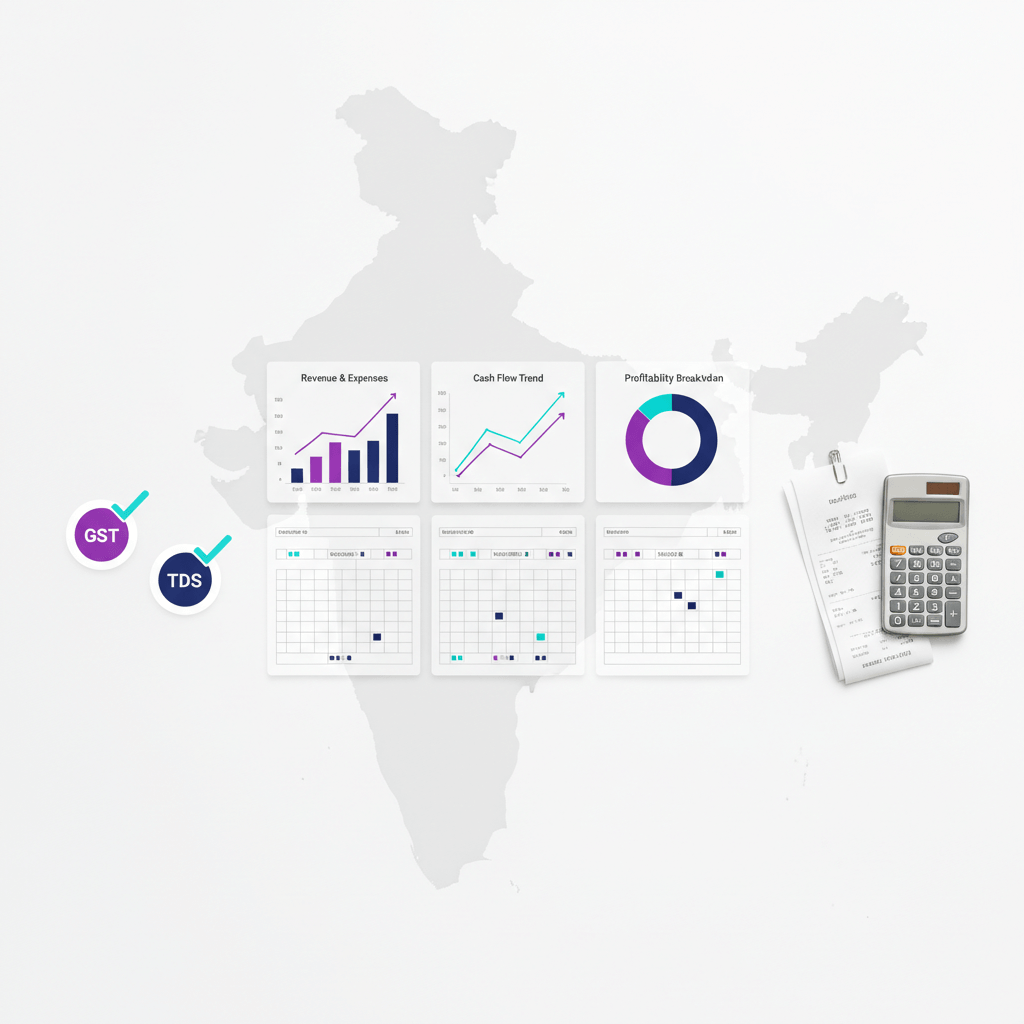
AI Accountant is a CA led managed accounting and compliance service with a centralized dashboard. The team handles bookkeeping, reconciliations, GST filings, TDS, income tax, advance tax, and ROC for eligible small companies, while the dashboard shows revenue, expenses, profit or loss, cash flow trends, burn, runway, AI generated insights and alerts, bank statement analysis, recent transactions, a secure document hub, and a compliance calendar.
This replaces fragmented workflows across email, Excel, and chat, giving a single source of truth. The CA team keeps books clean and on time, the dashboard makes analysis clear and continuous. Case: an SME used alerts on slow collections plus a CA led follow up plan to cut the cash conversion cycle from 90 to 60 days, adding about four months of runway without new capital.
Want a quick look, book a demo, AI Accountant.
Quick start checklist for financial performance analysis
Putting it all together
Financial performance analysis is a simple, repeatable discipline that puts your hands on the wheel. With clean books, a focused dashboard, a few proven frameworks, and a monthly rhythm, you will make better calls on pricing, costs, cash, and growth. If you want support without spreadsheets and email trails, a CA led virtual accounting model like AI Accountant blends expert execution with a live system, so reconciled numbers, MIS, cash flow, compliance status, and AI nudges live in one place.
Next steps
FAQ
How often should a founder run full financial performance analysis, and what is the minimum viable routine
Run a monthly cycle as your baseline, close by the tenth working day, publish a KPI dashboard with trends and ratios in week two, review and decide in week three, assign actions and update the rolling forecast in week four. Add a quarterly deep dive for strategy and an annual reset for budgets. For a primer, see Mozon Tech.
Which five to eight KPIs should an SME prioritize if bandwidth is limited
Gross margin, operating margin, DSO, inventory days, DPO, cash conversion cycle, runway, and ROE. If you are early stage, swap ROE for burn and payback period. Lists and benchmarks are available at Aviana Global and Klipfolio.
How does a CA led virtual accounting model like AI Accountant improve the monthly close and MIS
AI Accountant standardizes reconciliations for bank, AR, AP, GST, and TDS, enforces an accrual close, and pipes clean data into a live dashboard. You get AI alerts on anomalies, for example a sudden DSO spike, plus a CA review that translates variances into actions. This reduces cycle time and error rates versus email and spreadsheets.
We operate on cash basis for tax, can we still do accrual analysis for management without confusion
Yes, maintain tax books for filings, then post accrual adjustments for management reporting, revenue recognition, expense accruals, and working capital movements. Keep a reconciliation bridge each month so tax numbers tie to management numbers. A service like AI Accountant can automate the bridge and keep GST and TDS aligned.
What is a practical target for interest coverage and debt to equity for a growing SME
Interest coverage above 1 point 5 is a common guardrail, two plus is safer. Debt to equity below two to one is typical for many SMEs, but asset heavy sectors may tolerate more. Monitor alongside cash flow from operations, not just EBITDA, to ensure debt serviceability under stress.
How do I use DuPont analysis to explain a dip in ROE to my board
Split ROE into margin, turnover, and leverage. If margin fell while turnover and leverage are steady, the culprit is cost or pricing. If asset turnover fell, investigate working capital or underutilized fixed assets. If leverage rose while ROE fell, debt did not translate into accretive returns, revisit capital allocation. See structure at CFI.
What benchmarks should a SaaS finance head track beyond GAAP margins
MRR or ARR growth, net revenue retention, gross margin after customer support, CAC by channel, payback period, and LTV to CAC. Pair these with DSO and cash conversion cycle, since collections and prepaid liabilities shape runway. AI Accountant dashboards can segment CAC and payback by cohort for faster action.
How should we structure a driver based forecast that updates monthly
Define a small set of drivers, price, volume, conversion, onboarding lag, headcount, and productivity. Map each line item to a driver, for example revenue equals price times volume, support costs equal tickets times cost per ticket. Update drivers monthly with actuals, roll forward twelve months, and run base, upside, downside scenarios. For a service assisted setup, see AI Accountant on forecasting.
What are early warning signals that cash conversion is deteriorating, and how should we respond
Rising DSO, growing credit notes, inventory days creeping up, and a widening gap between EBITDA and operating cash flow. Respond by tightening credit terms, implementing dunning cadences, clearing slow moving SKUs, and negotiating DPO where fair. AI Accountant can trigger alerts when CCC crosses thresholds, then coordinate CA led follow ups.
How do GST and TDS workflows interact with accrual accounting and management dashboards
Post accrual entries for revenue and expense recognition, then reconcile GST outward and inward supplies and TDS deductions monthly to the ledger. Mismatches can inflate DSO and distort margins if left uncorrected. A managed service like AI Accountant keeps statutory schedules in sync with books, so your dashboard reflects true economics.
What governance cadence do boards expect around financial analysis for a venture backed startup
Monthly close and KPI deck by day ten to twelve, cash and runway review weekly, quarterly board packs with variance analysis, DuPont ROE or rule of forty style metrics where relevant, and an annual plan with driver based scenarios. Keep an audit trail of adjustments and action logs.
We have fragmented data across POS, ERP, and banking, what is the fastest path to a single source of truth
Start with bank feed reconciliation, then AR and AP subledger ties, then tax reconciliations, then standardize the chart of accounts. Stand up a dashboard that ingests from each system but anchors to the reconciled general ledger. AI Accountant provides the CA led clean up plus a centralized dashboard, reducing integration thrash.
Which KPIs should link to compensation for finance and operating leaders
For finance, close timeliness, reconciliation completeness, forecast accuracy, and DSO. For operations, contribution margin, inventory turns, and on time collections support. Keep a shared metric for operating cash flow to align teams.
What is a sensible break even analysis for a multi product SME, and how often should we revisit it
Compute contribution margin by product, then calculate a weighted average contribution margin for the portfolio. Break even units equal fixed costs divided by weighted contribution per unit, update quarterly, or when pricing, mix, or cost structures shift.
Can an AI enabled service like AI Accountant replace our internal analyst for dashboards and variance notes
AI Accountant can automate data prep, reconciliations, and dashboards, and draft variance explanations using rules and patterns. Many teams still keep an internal owner for business context, pricing strategy, and action follow through. The result is a leaner, faster cycle with clearer ownership.