Key takeaways
- An expense analytics dashboard unifies bills, bank feeds, and ledgers into one real time view, replacing month end surprises with proactive cost control across cost centres, departments, and vendors.
- Four core modules (cost centre trend charts, department budget versus actual, vendor spend analysis, and anomaly flags) work together to prevent overruns, surface negotiation leverage, and catch duplicate payments before they hit the books.
- Track the KPIs that drive action: budget variance percentage, vendor concentration index, discount capture rate, duplicate payment frequency, and exception volumes. These convert scattered data into measurable savings.
- Most Indian SMEs and CA firms see payback in three to six months, with 10 to 15 percent expense reduction in year one, making early implementation a competitive advantage heading into FY 2026 27.
- Standardize inputs and enforce validation rules first. Without clean master data, even the best dashboard produces misleading insights and audit headaches.
- AI Accountant's MIS reporting automates bill extraction, bank feed normalization, and GST reconciliation, giving CA firms and finance teams the clean, structured data foundation that makes expense analytics dashboards decision ready from day one.
Expense Analytics and Cost Centre Dashboards: What's New in 2026
Until March 2025, GST e-invoicing applied only to businesses with aggregate turnover above ₹5 crore. From April 2025, the threshold dropped to ₹1 crore, pulling a significantly larger pool of SMEs into mandatory e-invoicing as outlined in CBIC Notification No. 17/2024 Central Tax. This means expense analytics dashboards now need to ingest and validate structured e-invoice JSON data alongside traditional PDFs and CSVs, adding new reconciliation steps to weekly workflows.
The operational shift is tangible. Finance teams must now match IRN (Invoice Reference Numbers) during vendor bill ingestion, cross verify e-invoice portal data with GSTR-2B auto populated returns, and flag mismatches before filing. For CA firms managing multiple clients, this multiplies reconciliation volume considerably. Businesses that still rely on manual matching risk ITC reversals, interest at 18 percent per annum under GST portal guidelines, and blocked filings that delay refunds.
The impact is sharpest for businesses in the ₹1 crore to ₹5 crore turnover band, many of which are adopting structured invoicing for the first time. Firms already above ₹10 crore feel it less, but face tighter validation expectations from the GSTN portal, including real time error reporting on mismatched HSN codes.
What to do now:
- Audit your vendor master to confirm every active supplier's e-invoicing status and IRN generation compliance before your next quarterly close.
- Add IRN and e-invoice status as fields in your expense analytics dashboard so mismatches surface during weekly anomaly sweeps, not during audits.
- Review your GSTR-2B reconciliation workflow to ensure auto populated ITC matches your purchase register within the filing window.
Teams already using automated GST reconciliation workflows can absorb this expanded e-invoicing scope without adding manual headcount, since IRN validation and GSTR matching run as part of the existing ingestion pipeline.
How to Use Expense Analytics Dashboards: Cost Centre Trend Charts, Department Budget Analysis, and Vendor Spend Insights for Maximum Savings
An expense analytics dashboard becomes your financial command center. It turns scattered PDFs, emails, and ledger entries into a clear, real time picture of where money flows.
For CA firms and finance teams across India, this means fewer surprises, fewer late month scrambles, and more proactive control. With the right design, you gain visibility into where money goes, who gets paid, and which departments approach or exceed budgets.
When you can see where money flows, controlling it becomes straightforward. When variances appear in real time, prevention replaces reaction.
The best dashboards excel at four modules: cost centre trends, department budget versus actual, vendor spend analysis, and anomaly flags. Together, they eliminate blind spots and accelerate decision making.
Why Expense Analytics Dashboards Matter for Indian Businesses
The Current State of Expense Tracking
Most Indian SMEs and CA firms juggle GST compliant invoices in inboxes, bank statements in assorted formats, and partial accounting records across Tally or Zoho Books. Cost centre tags, when used, are often inconsistent.
The result is delayed variance discovery, hidden vendor price creep, and duplicate payments that only surface during audits or month end reviews. Without a unified view, finance teams spend more time hunting for data than acting on it.
Benefits of Centralized Expense Analytics
Centralized dashboards turn chaos into clarity. Here is what changes:
- Proactive budget control with real time variance alerts that flag overruns before they become permanent.
- Vendor negotiation leverage through transparent spend patterns and rate trend visibility.
- Automated compliance and anomaly detection that flags GST mismatches, duplicates, and outliers instantly.
- Faster month end closes as cleaner data flows into your books with fewer manual corrections.
According to ICAI's guidance on technology adoption for CA practices, firms that embrace automated analytics see measurable improvements in both compliance accuracy and client service delivery timelines.
Essential Modules of an Expense Analytics Dashboard
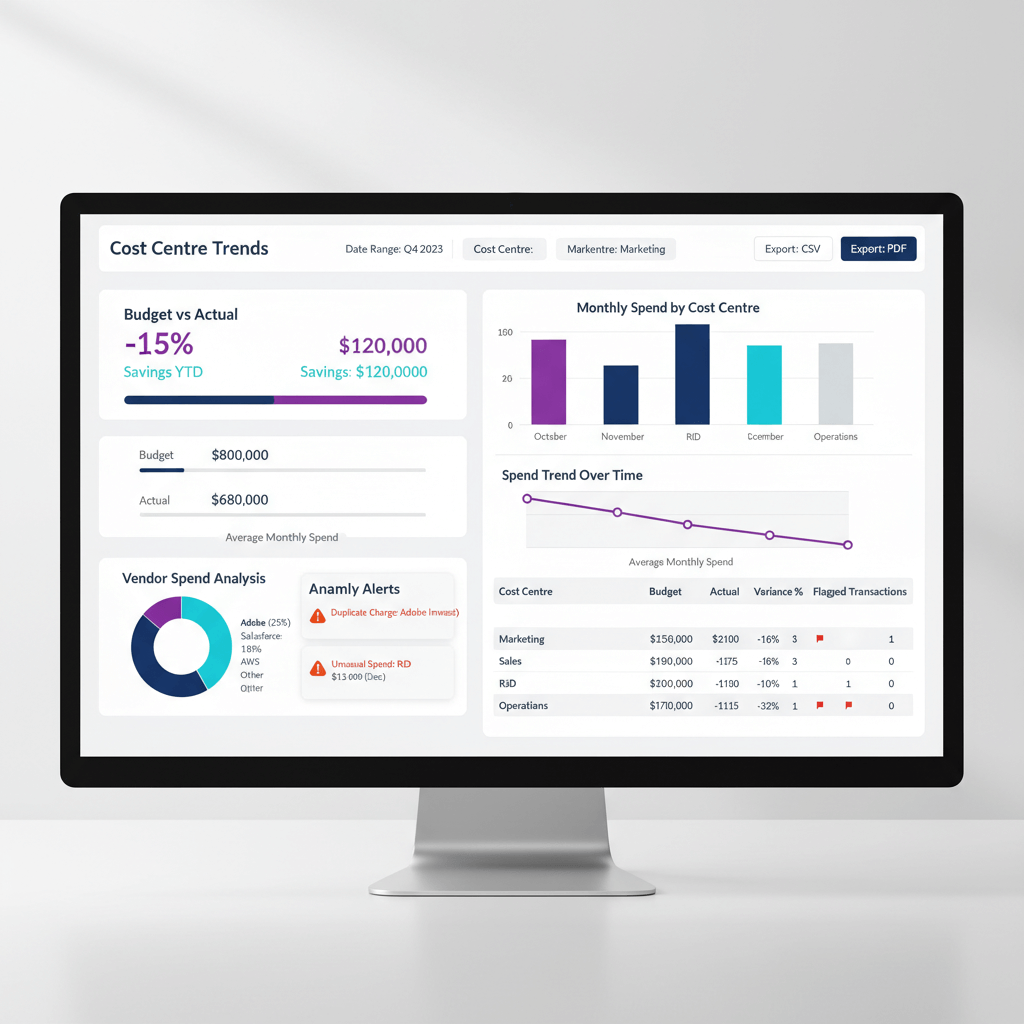
Cost Centre Trend Charts: Spotting Patterns and Spikes
Trend charts show how spending evolves across units, projects, or locations. Line charts for monthly trends and stacked bars for category breakdowns reveal seasonality and outliers at a glance.
Smart filters by time, category, and entity make findings actionable. Watch for:
- Steady increases that signal rate creep or headcount growth
- Sudden spikes that warrant investigation
- Seasonal cycles that inform cash flow planning
Cost centre trend analysis is most powerful when your chart of accounts and tagging conventions are consistent. Even a simple line chart becomes misleading if departments tag the same expense differently.
Department Budget versus Actual: Managing Variances Proactively
Budget versus actual analysis at the department level keeps you ahead of overruns. Variance waterfalls pinpoint where gaps originate. Heatmaps highlight at risk areas. Rolling forecasts project quarter end outcomes so you can reallocate or freeze spend early.
Drill downs from any variance to the transaction level make reviews concrete and collaborative. Department heads stop debating data quality when they can see the actual invoice or ledger entry behind each number.
Vendor Spend Analysis: Finding Negotiation Opportunities
Vendor spend analysis aggregates payments by supplier, exposing concentration risks and price changes over time.
- Pareto charts spotlight over dependence on a few vendors.
- Rate analysis catches quiet price hikes across billing cycles.
- Payment term reviews reveal early discount opportunities worth capturing.
Duplicate vendor detection, often using GSTIN as the unique key, consolidates aliases to show true spend. Without this step, a single supplier with three name variations can appear as three separate relationships, hiding your actual negotiation power.
Anomaly Flags: Catching Errors and Fraud Early
Automated anomaly detection flags statistical outliers, duplicate payments, off hour postings, and category mismatches that could affect GST claims. These flags act as an early warning system for both honest mistakes and potential fraud.
Severity tiers (critical, medium, low) help teams triage effectively. Start with conservative thresholds and tune quarterly to reduce false positives while protecting against leakage.
Key Metrics and KPIs to Track
Core Expense Metrics for Indian Businesses
Turn raw data into decisions with focused KPIs:
- Operating expenses by category and cost centre for granular spend visibility
- Budget variance percentages with tolerance levels (typically 5 to 10 percent)
- Vendor concentration index for supplier risk management
- Early payment discount capture rate to measure working capital efficiency
- Duplicate payment frequency by count and value
- Exception rates for data quality and GST completeness
These KPIs matter most when reviewed together. A low duplicate payment frequency paired with a high exception rate, for example, suggests your controls catch errors but your data entry process needs attention.
Building Your Data Foundation
Essential Data Inputs and Standardization
Start with clean inputs:
- Vendor bills in PDF, Excel, or CSV
- Bank and credit card statements
- Ledger data from Tally or Zoho Books
- Master data for departments, cost centres, and vendors
Standardize fields: date, department, cost centre, category, vendor name, GSTIN, base amount, and tax amount. Enforce hierarchies: Organization → Department → Cost Centre → Vendor → Category → Time Period.
Apply validation rules so GSTINs match vendor names, departments exist in the master, amounts fall within expected ranges, and dates align to open periods. These rules are your first line of defense against dirty data that corrupts every downstream analysis.
Visual Design Best Practices
Creating Clear and Actionable Displays
Choose chart types based on what you need to communicate:
- Time series lines and stacked bars for cost centre trends
- Variance waterfalls and heatmaps for budget versus actual comparisons
- Pareto and scatter plots for vendor concentration and rate shifts
- Alert panels for anomalies with severity filters
Keep displays simple, consistent, and focused on decisions. Every chart should answer one question clearly. If you need a legend longer than five items, the chart is probably trying to do too much.
Practical Implementation Workflows
Weekly, Monthly, and Quarterly Cadences
Weekly: Ingest new bills and bank statements, run anomaly detection, clear critical flags, and update vendor masters with any new suppliers.
Monthly: Reconcile the prior month, analyze vendor patterns for negotiation targets, review department variances with leadership, and refresh forecasts for the next period.
Quarterly: Renegotiate with top vendors using spend data, refine cost centre allocations, adjust anomaly thresholds based on false positive rates, and update approval workflows to reflect any organizational changes.
This cadence keeps your dashboard decision ready. Skip a cycle and data quality degrades fast, turning your analytics from a command center into a rearview mirror.
Step by Step Implementation Guide
Setting Up Your Expense Analytics Dashboard
Step 1: Define master data structures. Finalize department, cost centre, and vendor lists aligned to GST registrations. Establish category hierarchies and naming conventions that everyone follows.
Step 2: Establish data ingestion. Automate imports for bills and bank feeds. Apply validation rules at the point of entry. Map all incoming data to a standard schema.
Step 3: Build the four modules. Start with cost centre trends, then add department budgets, layer vendor analysis, and implement anomaly detection conservatively. Each module builds on the data quality of the previous one.
Step 4: Assign review ownership. Department heads own budget views. Procurement owns vendor analysis. Finance owns anomalies. Define clear escalation paths so flagged items reach the right person within 48 hours.
Step 5: Create a savings playbook. Prepare vendor negotiation templates, switching business cases, and budget reallocation approval workflows. These accelerate action when the dashboard surfaces an opportunity. Without a playbook, insights sit in charts instead of driving results.
Common Pitfalls and Solutions
Avoiding Dashboard Failure Points
- Inconsistent tagging derails trends. Fix with enforced dropdowns and monthly audits of cost centre and category assignments.
- Stale budgets produce false variances. Fix with automated budget uploads and quarterly reviews with department heads.
- Vendor name variations hide true spend. Fix with a GSTIN based master and alias mapping that merges duplicates.
- Over flagging leads to alert fatigue. Fix with calibrated thresholds, severity tiers, and quarterly precision reviews.
- Poor adoption comes from limited enablement. Fix with role based training, walkthroughs, and sharing early success stories across teams.
Real World Examples and Expected ROI
Actual Savings from Indian Businesses
Here is what expense analytics dashboards have delivered in practice:
- Marketing spikes: Trend analysis revealed premium rush charges. Renegotiation saved 15 percent on agency fees.
- IT variance: Budget versus actual exposed SaaS sprawl across departments. Consolidation cut software costs by 25 percent.
- Vendor concentration: Pareto analysis triggered competitive bids. Logistics rates dropped 10 to 20 percent.
- Anomaly detection: Duplicate billing flagged automatically. Recovery saved 5 percent of annual operating expenses.
Typical payback arrives in three to six months, with double digit reductions in year one. The key is acting on insights quickly, not just viewing them. According to a PwC India data and analytics report, businesses that embed analytics into operational workflows see returns two to three times faster than those that treat dashboards as passive reporting tools.
Tools and Technology Options
Choosing the Right Platform
Match tools to your complexity and resources:
- AI Accountant automates bill extraction, bank feed normalization, transaction mapping, Tally sync, and GST reconciliation. Built for CA firms and SME finance teams in India.
- QuickBooks provides basic expense workflows suitable for smaller teams with straightforward needs.
- Xero offers cloud based bookkeeping with solid bank feed integrations.
- FreshBooks suits simple setups with clean invoicing and expense tracking.
- Tableau and Power BI offer powerful visualization when paired with strong data prep and clean upstream sources.
The right choice depends on your data volume, team size, and how deeply you need GST compliance woven into your analytics. For Indian businesses on Tally, tight integration matters more than flashy dashboards.
Governance and Change Management
Ensuring Successful Adoption
Set clear tagging and approval policies from day one. Apply role based access so each user sees the data relevant to their decisions, nothing more.
Invest in targeted training. A 30 minute walkthrough specific to each role (department head, procurement lead, finance analyst) drives adoption faster than generic sessions.
Use a pilot to prove value with one department or cost centre, then scale. Measure logins, feature usage, cycle times, and variance reductions. Iterate based on user feedback and keep a quarterly improvement rhythm.
Taking Action on Your Expense Analytics Journey
Start with clean data and one module: cost centre trends. Add department budgets, vendor analysis, and anomaly flags as teams gain confidence.
Prioritize actionable insights over perfect visuals. Codify a savings playbook so wins repeat and compound. The payoff is rapid: transparency raises negotiating power, variances shrink, and month end becomes predictable.
The businesses that move first build institutional knowledge that compounds. Every quarter of clean data adds to your negotiation leverage, forecasting accuracy, and audit readiness.
FAQ
How should a CA firm structure cost centre hierarchies for analytics if we maintain books in Tally and Zoho Books?
Define a unified hierarchy: Organization → Department → Cost Centre → Vendor → Category → Time Period. Create a crosswalk table that maps Tally cost categories and Zoho tracking categories into this standard. Use GSTIN and vendor PAN to deduplicate vendors. Maintain the crosswalk centrally and refresh it monthly before you run reports.
What variance threshold is practical for department budget versus actual in an Indian SME context?
Start with 10 percent tolerance at the department level and 5 percent at the category level. Add absolute rupee floors (for example, ₹25,000) so minor items are not flagged. Review true versus false positives after one quarter, then tighten or relax thresholds accordingly.
How can AI Accountant help with GST reconciliation alongside expense analytics?
AI Accountant automates extraction of invoice data, validates GSTIN against vendor records, reconciles purchase registers with GSTR filings, and flags mismatches as anomalies. With the April 2025 e-invoicing threshold now at ₹1 crore, it also validates IRN data during bill ingestion (2026 update). This reduces manual checks and ensures your dashboard reflects GST accurate categorization.
What is the best way to detect duplicate payments across ledger and bank statements?
Use multi key matching: vendor identifier, normalized invoice number, invoice date window, and fuzzy amount matching. Flag near duplicates (similar amounts within a tolerance over a short window) and exact duplicates. Prioritize by value and vendor risk, then route to finance for resolution within 48 hours.
How many months of history do we need for robust vendor rate and Pareto analysis?
Use 12 to 24 months of data. Twelve months captures seasonality, while 24 months highlights multi year rate changes. Anything less can miss annual cycles. Anything more can include outdated vendor relationships that distort current decisions.
How does the April 2025 e-invoicing threshold change affect expense analytics dashboards?
Businesses with turnover above ₹1 crore must now generate e-invoices, down from the earlier ₹5 crore threshold (2026 update). Your expense analytics dashboard should include IRN and e-invoice status as trackable fields. This ensures GSTR-2B reconciliation runs cleanly and ITC claims are not blocked due to missing or mismatched Invoice Reference Numbers.
What is the right starting module if our data quality is uneven?
Begin with cost centre trend charts. They are the least complex and surface data issues quickly. As data quality improves, add department budget versus actual, vendor spend analysis, and finally anomaly flags with cautious thresholds. Tools like AI Accountant can accelerate data cleanup and validation from day one.

Rohan Sinha is a fintech and growth leader building aiaccountant.com, focused on simplifying accounting and compliance for Indian businesses through automation. An IIT BHU alumnus, he brings hands-on experience across 0 to 1 product building, growth, and strategy in B2B SaaS and fintech.