-01%201.svg)

Key takeaways
- Expense analytics dashboards convert raw transactions into actionable intelligence for Indian SMBs, giving real time visibility across departments, cost centers, vendors, and compliance.
- Automated data ingestion from Tally, Zoho Books, and bank statements removes manual work while improving accuracy and auditability.
- Design around decision-ready KPIs, including department wise spend analysis, vendor concentration, budget vs actual, cash runway, GST and TDS tracking, and exception alerts.
- Use opex trends visualization that adds context, such as rolling averages, seasonality overlays, waterfall analysis for change, and heatmaps for patterns.
- Cost center dashboard reports deliver drill down from entity to project to transaction, accelerating month-end and audits.
- For Indian contexts, incorporate GST, TDS, and GSTR-2B reconciliation views to prevent leakages and reduce compliance risk.
- Evaluate DIY spreadsheets versus specialized tools using a clear build vs buy framework, then standardize workflows and alerts to drive action.
- AI Accountant offers India-first automations, Tally and Zoho sync, OCR for local bank formats, and pre-built metrics, helping teams move from data chaos to financial clarity quickly.
What is an Expense Analytics Dashboard?
An expense analytics dashboard is an integrated, real time command center that consolidates, categorizes, and visualizes operating expenses across systems. It upgrades you from a simple tracker that lists spends to an intelligent layer that answers where the money goes, why it changes, and what to do next. The most effective dashboards connect data from bank statements, Tally or Zoho Books, vendor invoices, and GST returns, then map everything to departments and cost centers with consistent rules.
For Indian SMBs, the magic is in tax and format awareness, covering GST codes, TDS calculations, and local bank narration patterns, so your team focuses on insights rather than cleanup. For a broader analytics perspective, see the Ultimate Guide to Dashboards for Financial Analytics.
Insight beats hindsight, every month. Your dashboard should tell you what changed, why it changed, and the next best action.
Essential KPIs and Metrics for Expense Tracking
Anchor your operating expense tracker on decision-ready KPIs across four pillars: overall health, department performance, vendor relationships, and compliance.
Fundamental opex tracker metrics
- Total operating expenses with monthly run rate and opex as a percentage of revenue.
- Fixed versus variable split, showing operating flexibility over time.
- Monthly burn and cash runway, with year over year growth markers and GST inclusive versus exclusive views for cash timing.
Department wise spend analysis
- Budget versus actual with variance flags, plus rolling 3 month comparisons.
- Headcount adjusted spend per employee to link cost with productivity.
- Discretionary versus non discretionary mix, so leaders know where to trim first.
Vendor and payment intelligence
- Concentration analysis using the 80,20 lens, guided by vendor management dashboards.
- Payment cycles, credit terms, and documentation hygiene, supported by accounts payable automation.
- TDS implications on payouts, linking to approval thresholds and cash plans.
Cash flow and compliance views
- Cash runway using cash flow dashboards and working capital trends from working capital tools.
- GST and TDS monitoring, including GSTR-2B reconciliation alerts and input tax credit checks.
For a holistic metric catalog, revisit the financial analytics dashboard guide.
Opex Trends Visualization That Drives Action
Line charts with context
Pair monthly lines with rolling 3 month averages, add seasonality overlays, and annotate Indian context like GST deadlines, festive peaks, and year-end cycles.
Waterfall charts for change analysis
Explain shifts with a clear bridge from last month to this month, quantifying category level increases and savings, turning vague spikes into board ready narratives.
Heatmaps for department and time patterns
Spot intensity by department or vendor across months, quickly locating irregular billing, processing delays, or budget creep.
Common pitfalls to avoid
- Clean data before charts, separating one offs, prepaids, and accruals.
- Normalize foreign currency effects and business days per month.
- Present GST inclusive and exclusive views to prevent cash flow confusion.
Real example: A Mumbai D2C brand saw October and February spikes tied to Diwali and Valentine’s campaigns, improved budgeting, then trimmed wasted ad spend without hurting sales.
Department Wise Spend Analysis Setup
Define a clear department structure
Start with how you actually operate, document edge cases like recruitment ads or shared tools, and keep sub-departments only where decisions depend on that split.
Map your chart of accounts
Align ledgers from Tally or Zoho Books to departments, create vendor master mapping rules, and auto-route typical vendors to the right buckets. Use narration cues, GST codes, and allocation rules when ledgers span multiple teams.
Handle mixed or unclear transactions
Maintain an Unallocated bucket that stays below 5 percent, then make cleanup a month-end ritual. Allocate shared costs on headcount, revenue, or usage, with documented logic baked into your automation.
Validation and quality control
- Set anomaly flags when unlikely expenses hit a department.
- Run monthly manager sign-offs to build ownership.
- Update automation when repeated reclassifications emerge, and consider smart rules using intelligent ledger mapping.
Cost Center Dashboard Reports
Cost centers versus departments
Departments mirror org structure, cost centers mirror activities or projects, so a software license may show in IT for department views and be split across client projects for cost center reporting.
Essential widgets
- Total by cost center for month and YTD, with budget versus actual variances, and red flags when over limits.
- Project or location P and L if revenue is tracked by cost center, especially useful for services and multi-site firms.
- Time series for 12 month patterns to plan seasonality and maintenance cycles.
Drill down that accelerates reviews
From totals to ledgers to transactions to source documents, then allow inline reclassification to fix issues at the root, not just in reports.
Multi-entity and CA firm scenarios
Consolidate across entities with role based visibility, apply inter-company eliminations, and roll up to group views, all while keeping audit trails robust. For broader dashboard patterns, see the finance dashboards guide.
From Insight to Workflow
Monthly close integration
Make dashboard review part of close: reconcile, refresh, analyze key questions, and fix misclassifications before finalizing books.
Automated alerts and thresholds
Alert when departments breach 120 percent of a rolling average, when vendor payments cross approval limits, or when runway drops under three months using AI powered cash flow forecasting. Add GST specific checks using reconciliation automation, with action oriented suggestions rather than generic warnings.
Procurement and vendor management
Leverage vendor concentration, payment behavior, and documentation quality to negotiate smarter, support reviews with payment gateway data, and streamline with AP automation.
Stakeholder communication
Tailor views for CFOs, department heads, and founders, then email summaries with highlights and next steps. For board packs, consider management reporting packages that pull live data instead of static slides.
Data Sources, Integrations, and Technical Setup
Primary data sources
Combine bank feeds driven by the Account Aggregator framework, accounting data from Tally reconciliations and Zoho bank feeds, and invoice details captured via invoice OCR.
Data cleaning and normalization
Standardize vendor names across banks, UPI, and ledgers, extract payment modes and transaction types, then maintain a vendor master that consolidates GST numbers and aliases used in different systems.
Secure, compliant operations
Insist on certifications like SOC 2 Type II, apply role based access, and keep immutable audit trails for every change.
Automated refresh and monitoring
Schedule daily bank updates and weekly accounting sync, then monitor health with reconciliation automation and anomaly alerts such as duplicate transaction detection. Maintain backups so history persists even if source systems evolve.
Build vs Buy Decision Framework
Use an explicit lens around setup time, maintenance load, ingestion automation, India-specific support, multi-entity needs, and security.
DIY with Excel and Power BI
Great for flexibility and custom logic, but data ingestion and ongoing maintenance quickly consume days each month, especially with Indian bank formats and evolving GST needs.
Specialized tools
- AI Accountant, India first automations for bank OCR, Tally and Zoho sync, and AI categorization aligned to local workflows.
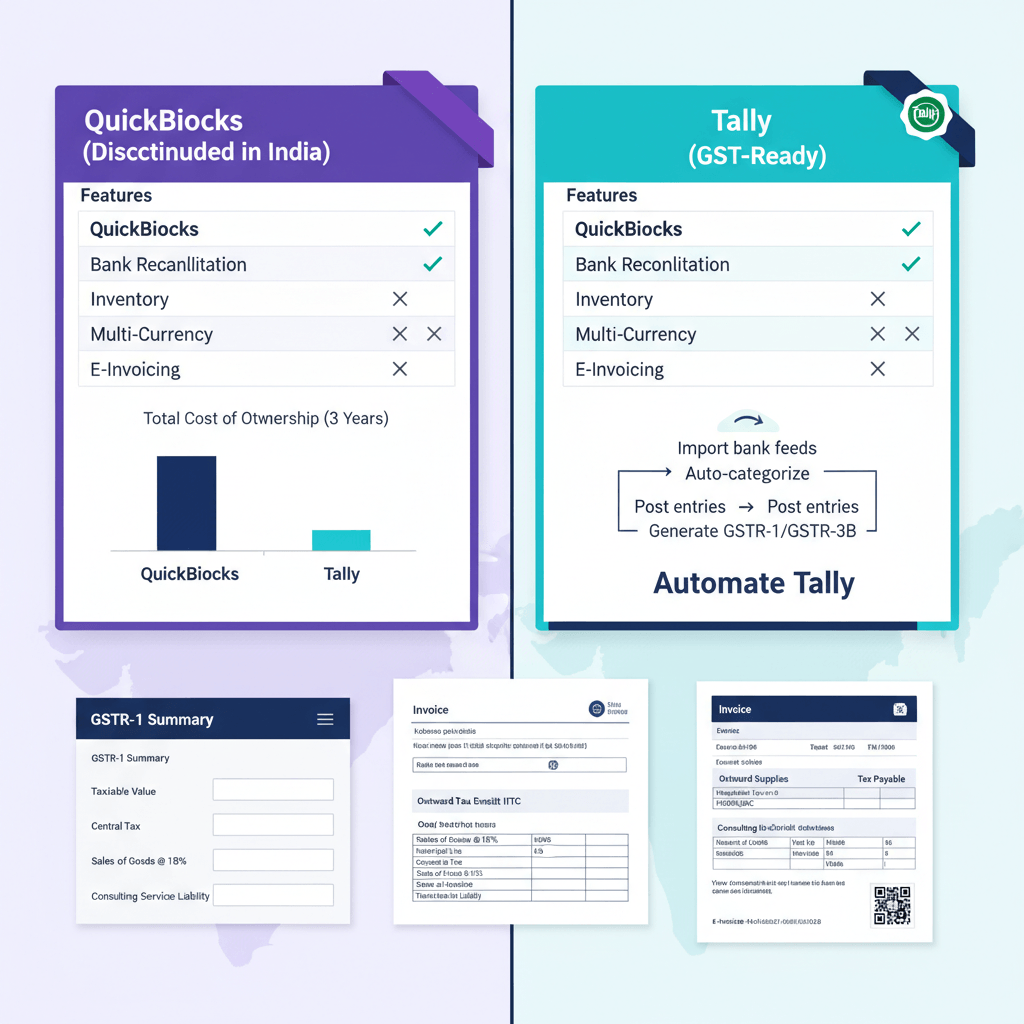
- QuickBooks, reasonable expense tracking, extra setup for Indian GST and banking norms.
- Xero, strong visuals and ecosystem, growing India support.
- FreshBooks, good for services, lighter for complex manufacturing.
- Zoho Analytics, flexible dashboards that pair well with Zoho Books.
Comparison highlights
- Setup, DIY is quick but fragile, specialized is structured but durable.
- Maintenance, DIY grows heavy, platforms stay light with automation.
- Data ingestion, DIY remains manual, platforms offer connectors and OCR.
- Compliance, DIY manual tracking, platforms embed GST, TDS, and documentation flows.
- Security and access, DIY limited, platforms offer roles, logs, and certifications.
For a structured evaluation, review the AI accounting software comparison for India.
How AI Accountant Simplifies Expense Analytics
Automated bank statement processing
OCR and natural language parsing trained on Indian formats extract vendors and modes from PDFs of ICICI, HDFC, SBI, and more, then learn from your approvals to keep improving.
Seamless Tally and Zoho sync
Bi directional integrations align dashboards with your books, so categorizations use your actual ledgers, cost centers, and vendor masters, preserving single source of truth.
Pre-built Indian business intelligence
Out of the box KPIs for GST input credit, TDS patterns, vendor cycles, and seasonality aware trend lines, plus department wise and cost center templates for common SMB archetypes.
Multi-entity and CA firm workflows
Consolidated views with role based partitions, inter-company eliminations, and drill downs that keep audits clean while enabling group insights.
Quiet assistant philosophy: Let automation handle ingestion, classification, and anomaly flags, so your team spends time on analysis, not admin.
Explore additional dashboard concepts in the financial analytics guide to extend your setup.
Real World Indian SMB Case Examples
D2C fashion brand, seasonal intelligence
Marketing spikes aligned with Diwali and Valentine’s once viewed in context, shifting budgets to high ROI channels and trimming waste, saving 25 percent with steady revenue.
Manufacturing SME, plant cost center optimization
Cost centers per line exposed energy inefficiency on a legacy line, building the case for upgrades, while quality control costs informed pricing for complex parts.
IT services firm, client profitability clarity
Full cost allocations revealed a marquee client as barely profitable, contract terms were reworked, and business development shifted toward high efficiency engagements.
Retail chain, regional benchmarking
Store wise dashboards showed a high revenue location with disproportionate costs, while best practices from a lean store were replicated across the network.
Getting Started Checklist
Phase 1, data foundation
- Connect accounting, validate your chart of accounts in Tally or Zoho.
- Gather 12 months of bank statements, PDFs, CSVs, or Excel work.
- Document approval workflows and department structures.
- Clean the vendor master using intelligent ledger mapping to merge aliases.
Phase 2, structure definition
- Define departments and, where needed, cost centers for projects or locations.
- Set allocation rules for rent, utilities, and shared licenses.
- Write categorization guidelines for edge cases, then publish them.
Phase 3, dashboard configuration
- Build core views, trends, department wise, vendor concentration, budget versus actual.
- Enable automated ingestion from banks and accounting systems.
- Start with conservative alert thresholds, then refine.
- Set user access per role to maintain confidentiality.
Phase 4, validation and training
- Run a parallel month, compare results, investigate variances.
- Train users on drill downs and reclassification workflows.
- Embed dashboard checks into month-end routines.
Phase 5, optimization and expansion
- Make the dashboard your primary analysis layer, monitor quality continuously.
- Add cost centers, multi-entity, or predictive models as you mature.
- Review rules, alerts, and layouts quarterly to match business changes.
Pro tip: Add a quick-win backlog, for example, a vendor concentration widget, waterfall for month-on-month change, and a GST variance panel. Deliver value in weeks, not quarters.
For more inspiration across FP&A and controllership, see the dashboard guide for finance leaders.
Transform Your Expense Management Today
Expense analytics is not a vanity dashboard, it is a discipline that bakes financial clarity into daily decisions. Start with clean data, clear structures, and smart visuals, then wire insights into approvals, budgets, and vendor negotiations. Whether you build selectively or adopt a platform like AI Accountant, the compounding benefits begin as soon as your team stops reconciling manually and starts managing by exception.
Next step: Connect your Tally or Zoho Books, enable automated bank ingestion, and stand up department wise spend analysis. The first month’s insights will usually fund the project through quick, visible savings.
FAQ
How is an expense analytics dashboard different from a basic operating expense tracker in accounting terms?
A tracker lists entries and totals, whereas a dashboard aggregates across sources, normalizes vendors, allocates to departments and cost centers, runs variance logic, and enables drill downs with audit trails. In practice, a CA uses the dashboard to test budget adherence, detect misclassifications before close, and support management with evidence, not just totals.
What is the recommended approach to map Tally ledgers to departments and cost centers without breaking audit trails?
Freeze a master mapping, keep allocations as rules documented in your policy, and apply changes prospectively with clear versioning. Use bi directional integrations so approved categorizations sync back to Tally, preserving voucher numbers and narration. Tools like AI Accountant maintain logs for every mapping change with user and timestamp.
How should I treat GST and TDS within the dashboard so that P&L and cash views reconcile?
Track GST-inclusive and exclusive amounts side by side. Exclusive flows to operating expense analytics, inclusive informs cash timing and credit cycles. Create separate categories for TDS withheld and remitted, then reconcile with statutory returns monthly. Use GST reconciliation automation to reduce manual matching.
As a CA managing multiple entities, how do I maintain client-wise segregation and still build a consolidated expense view?
Adopt a multi-entity model with role based access, one mapping standard across entities, and inter-company elimination rules. Consolidate at the data warehouse layer, then allow drill down into entity ledgers with immutable audit logs. AI Accountant supports entity partitions while surfacing consolidated KPIs to partners.
What cadence do you recommend for reviews, and which alerts should finance prioritize first?
Daily anomaly scans for large or unusual postings, weekly trend checks, monthly variance reviews with department heads, and quarterly policy updates. Prioritize alerts for budget breaches over 120 percent of rolling averages, duplicate or split payments, vendor concentration spikes, and runway dropping under three months using cash flow forecasting.
Can I rely on scanned bank statements for ingestion, or should I insist on CSV/Excel downloads?
Scanned PDFs work with strong OCR, especially if trained on Indian bank formats, but CSV or Excel is cleaner. A practical setup ingests whatever is available today, validates with exception queues, then moves stakeholders toward digital statements. AI Accountant supports both and learns from your corrections.
How do I allocate shared costs like rent, utilities, and software licenses in a defensible way?
Pick consistent drivers, such as seat count for rent, floor area for utilities, or actual usage for licenses. Document the driver and review quarterly. Build allocation rules into your dashboard so the logic executes automatically and is traceable down to vouchers and invoices.
What are the most common misclassification issues you see during month-end, and how do we fix them?
Employee meals coded to admin instead of HR, marketing services booked as professional fees, capex items sitting in opex, and advances treated as expenses. Address them with validation rules, a standing unallocated review list under 5 percent, and auto-suggestions trained on your history, which AI Accountant provides out of the box.
How do vendor concentration and payment behavior inform procurement strategy in dashboards?
Concentration highlights negotiation leverage and supply risk, while payment cycle analytics reveal working capital impact and documentation quality. Combine these with scorecards drawn from your AP automation to rationalize vendors, standardize terms, and reduce administrative churn.
What is the quickest path for a CA firm to standardize dashboards across clients with different systems?
Create a canonical chart of expense categories and department taxonomy, then map each client’s ledgers to this standard. Use connectors for Tally and Zoho Books, automate bank ingestion, and package a common KPI set with client-specific add-ons. AI Accountant supports template-based rollouts to compress onboarding time.
How do I ensure security and compliance while enabling non-finance users to view departmental dashboards?
Implement role based access at the department and entity level, enforce SSO where possible, and maintain SOC 2 aligned controls. Insist on complete audit trails for every data change or classification decision, as offered in SOC 2 Type II certified platforms.
What evidence do I present to management when expenses jump month-on-month to defend the numbers?
Use a waterfall to quantify change by category, annotate one-offs, show rolling average context, and attach drill down to invoices and bank entries. Add an action list, such as renegotiation targets and discretionary pauses. Dashboards like AI Accountant generate these bridges with links to underlying documents, making the case transparent and credible.

A results-driven finance and sales professional with hands-on experience through finance internships and a fast-paced sales role. With a strong interest in accounting and business finance, Harsh focuses on turning complex topics into clear, practical takeaways for founders and finance teams.