-01%201.svg)
Key takeaways
- A CXO dashboard multi-entity centralizes cash, debt, revenue, margins, and intercompany balances across all entities in real time, giving executives a single source of truth.
- Architect dashboards in layers: group-level summaries, entity tiles, and drill-downs to transactions, supported by point-of-view filters and strong access controls.
- Prioritize core tiles: group cash and debt, consolidated revenue and margins, intercompany netting with aging, and standardized entity KPI tiles with DSO and DPO.
- Normalize charts of accounts, currency, and policies before consolidation, then automate eliminations, reconciliations, and refresh cadences for reliable reporting.
- Adopt tools that automate ingestion and mapping, such as AI Accountant, to reduce manual work and accelerate insights.
- Follow a proven implementation checklist, validate numbers against bank statements and management accounts, and pilot before rolling out to the full group.
- Use references like real-time dashboards for multi-entity reporting and the benefits of multi-entity management to guide design decisions.
Why multi-entity visibility matters for executive decision making
Driving a multi-entity business without consolidated visibility is like flying in heavy fog, you may see individual dials but miss the bigger picture until it is too late. Fragmented Tally and Zoho instances, different charts of accounts, and manual consolidations combine to delay answers to simple questions: What is the current group cash runway, which entities are burning, are debt covenants at risk, where are intercompany mismatches hiding?
Real-time multi-entity dashboards replace spreadsheets with centralized financial intelligence. You catch cash crunches before they hit, replicate what works in profitable entities, and spot anomalies auditors would otherwise surface later.
The payoff is immediate: faster closes, confident board decks, and resource allocation driven by data, not assumptions.
For planning references and patterns, review real-time dashboards for multi-entity reporting and the benefits of multi-entity management.
Dashboard architecture overview for multi-company management
Think in layers, not lists. Build three tiers of insight: group-level summaries for the 30,000-foot view, entity KPI tiles for at-a-glance performance, and drill-down paths to transactions for investigation. Add POV filters to switch entities with a click, not another login. Refresh cadence matters, daily for cash, weekly for KPIs, monthly for full consolidations.
Security must be embedded. Implement role-based access controls so users see only their entities, and maintain audit trails of who viewed or changed what. For broader frameworks, see the overview of multi-entity benefits and real-time dashboards for multi-entity reporting.
Core dashboard tiles and metrics for consolidated reporting
Group cash and debt management tiles
Anchor your dashboard with liquidity and leverage. Essential tiles include total group cash, total debt, net cash or net debt, upcoming repayments, and undrawn credit limits. Ingest directly from bank feeds and loan ledgers to reduce errors.
- Handle inter-entity transfers carefully to avoid double-counting.
- Detect duplicate entries by enforcing entity tags at source systems.
- Reconcile timing differences from cash pools via automated workflows.
Design patterns are detailed in real-time dashboards for multi-entity reporting.
Consolidated revenue and margins analytics
Show consolidated revenue, gross margin percentage, and EBITDA margin percentage with MoM and YoY comparisons. Normalize disparate charts of accounts, remove intercompany sales, and standardize accounting methods to ensure apples-to-apples comparisons.
- Map entity accounts to a group standard before consolidating.
- Automate eliminations for intercompany transactions to avoid inflated revenue.
- Harmonize revenue recognition policies and basis of accounting.
Reference designs are available in real-time dashboards for multi-entity reporting and the overview of multi-entity benefits.
Intercompany balances reconciliation
Prevent audit surprises with tiles for intercompany receivables and payables by entity pair, net positions, and aging buckets. Deploy matching workflows that tag and auto-reconcile transactions and flag mismatches or round-tripping patterns.
Explore techniques for intercompany automation and eliminations and the overview of multi-entity benefits.
Entity-wise KPI performance tiles
Standardize one tile per entity, covering revenue, margin percentage, cash position, payables, receivables, DSO, DPO, and overdue counts. Enable drill-downs from any KPI to invoices or bills, and display variance versus plan with simple trend indicators.
See patterns in real-time dashboards for multi-entity reporting and the benefits of multi-entity management.
Drill-down design and user journeys for executive insights
Build intuitive data journeys, from group cash to entity totals, to bank accounts, then to individual transactions, each step one click. Add filters for time period, entity, vendor, bank, or loan, and include bulk actions for payment linking or batch reclassification.
Design principle: executives should move from signal to source in seconds, not sessions.
For working examples, review real-time dashboards for multi-entity reporting.
Data model and consolidation workflow best practices
Your data model is the difference between clarity and chaos. Start with master data syncs across all accounting systems, standardize naming conventions, and define durable mapping rules.
- Establish a data pipeline from books to dashboards for charts of accounts, vendors, and customers.
- Automate currency conversions and normalize GAAP differences using predefined adjustment rules.
- Identify, eliminate, and materiality-screen intercompany transactions to prevent month-end delays.
- For India, align GST reconciliations, match GSTR-2B to purchase registers, and normalize bank statement formats.
See guidance in real-time dashboards for multi-entity reporting and the overview of multi-entity benefits.
Operating cadence and governance framework
Dashboards need rhythm. Refresh cash and debt daily, update KPIs weekly, and complete monthly consolidations with formal sign-offs. Enforce role-based permissions, org switching, and audit trails to balance access with control. Schedule weekly reviews with entity heads, monthly budget variance reviews, and quarterly deep dives on underperformance.
More patterns are outlined in real-time dashboards for multi-entity reporting and the benefits of multi-entity management.
Implementation checklist for zero to live dashboard
- Inventory entities and data sources, establish a standard chart of accounts, and define a KPI dictionary.
- Connect Zoho Books, Tally, and other systems, sync master data, and pull historical transactions.
- Configure the intelligence layer, mapping rules, intercompany relationships, and consolidation logic.
- Validate tiles, cash and debt against bank statements, revenue and margins versus management accounts, and test elimination logic.
- Design user journeys, drill-throughs, and filters, then pilot with one or two entities before group-wide rollout.
Follow the detailed guide in real-time dashboards for multi-entity reporting.
How accounting automation tools support multi-entity CXO dashboards
Tools make consolidation practical. Evaluate platforms on multi-org ingestion, mapping, reconciliation, and drill-through UX.
- AI Accountant excels at multi-org management with entity learning, automated bank and card ingestion for real-time cash, intelligent mapping, invoice-payment linking, GST workflows, and ready-made entity KPI and consolidated views for Zoho Books and Tally users.
- QuickBooks Enterprise, good for basic multi-company consolidation, but requires heavier manual work for complex intercompany.
- Xero, suitable for smaller groups with some consolidation capabilities.
- NetSuite, robust multi-subsidiary consolidation, often heavy for SMEs.
- Sage Intacct, strong multi-entity and dimensional reporting, but needs substantial implementation effort.
See also real-time dashboards for multi-entity reporting and the benefits of multi-entity management for selection criteria.
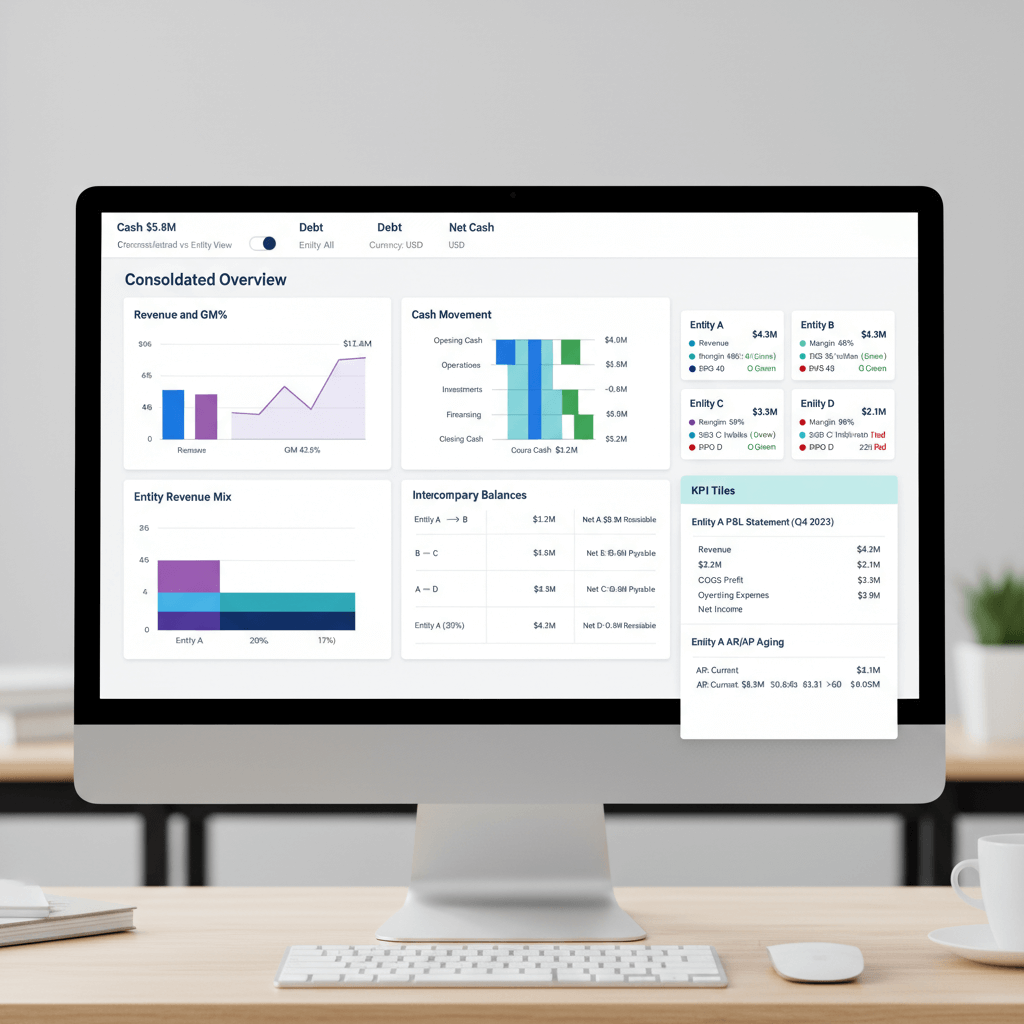
Example dashboard layout for multi-entity organizations
Picture a clean, decision-first layout. The top row shows total group cash and total debt with net position, plus consolidated revenue and margin metrics with quick trend arrows. The middle section highlights intercompany net positions and aging to target overdue settlements. The main grid presents consistent entity tiles, including revenue with MoM change, margin percentage versus budget, cash with runway days, DSO, DPO, and overdue counts, supported by sparklines. A bottom panel exposes drill-throughs to supporting ledgers and transactions.
Use the patterns in real-time dashboards for multi-entity reporting to guide build-outs.
Metrics definitions and formulas for standardization
- Gross margin percentage = (Revenue minus COGS) divided by Revenue, multiplied by 100, shows product profitability.
- EBITDA margin percentage = EBITDA divided by Revenue, multiplied by 100, indicates core operating efficiency.
- DSO = Receivables divided by Revenue, multiplied by days in period, measures collection speed.
- DPO = Payables divided by COGS, multiplied by days in period, measures supplier credit usage.
- Net cash or net debt = Total Cash minus Total Debt, a quick view of financial strength.
- Intercompany net position = Sum of intercompany receivables minus payables, should net to zero after eliminations.
Set elimination rules to remove 100 percent of intercompany transactions, map all ledgers to standards, and define a materiality threshold below one percent of group revenue to avoid noise. For references, consult real-time dashboards for multi-entity reporting and the overview of multi-entity benefits.
Common pitfalls and fixes in multi-entity reporting
- Duplicate entries, prevent via standardized master data and auto-detection rules on amount, date, and counterparty.
- Misclassifications, fix with bulk reclassification tools and disciplined account creation governance.
- Intercompany imbalances, enforce standard JE templates, run matching reports frequently, and resolve promptly.
- Currency confusion, automate conversions and lock policies for rate sources and timing.
- Timing differences, align cut-off procedures and use accruals to standardize closing schedules.
Deep dives are available in real-time dashboards for multi-entity reporting and the overview of multi-entity benefits.
Quick start guide for immediate implementation
- Connect your largest or most complex entities first to your dashboard platform.
- Run an initial sync for master data and recent transactions to establish baselines.
- Configure mappings and build first tiles, start with cash and revenue for quick wins.
- Validate against bank statements and recent audited or reviewed financials.
- Test drill-downs using live scenarios, refine, then expand to more entities.
Execution recipes are outlined in real-time dashboards for multi-entity reporting.
Moving from fragmented data to unified intelligence
A well-implemented CXO dashboard multi-entity replaces scrambling with clarity. You know today’s cash, this week’s runway, this month’s margins, and every intercompany position with confidence. You have a roadmap for metrics, a cadence for refreshes, and tools that automate the plumbing so your team can focus on decisions, not data stitching.
Stop managing in the dark, start leading with clarity. Build your integrated financial command center and put unified intelligence at the center of every executive conversation.
FAQ
How do I consolidate cash across multiple entities without double-counting inter-entity transfers?
Tag source transactions with an entity identifier at ingestion, then classify inter-entity transfers into designated GLs that are excluded from consolidated cash. Use automated matching rules to pair the debit in Entity A to the credit in Entity B, and net them out at the group level. Tools like AI Accountant can auto-detect these patterns from bank feeds and ledgers, preventing overstatement of liquidity.
What is the fastest way for a CA firm to deploy a pilot multi-entity dashboard for a client group?
Start with a two-entity pilot, connect accounting systems, run a master data sync, and build tiles for group cash, total debt, and consolidated revenue. Validate with bank statements and management accounts, then add intercompany and entity KPI tiles. A focused pilot often goes live in two weeks when using ingestion and mapping automations from an AI tool like AI Accountant.
How should I standardize charts of accounts across subsidiaries that use different naming conventions?
Create a group standard, then map each entity’s account list to that standard using a controlled mapping table. Lock down new account creation with approvals, and schedule recurring reviews for exceptions. Platforms with learned mappings, such as AI Accountant, reduce manual maintenance by recognizing recurring patterns.
What cadence should I set for refreshes if my board asks for weekly consolidated insights?
Use a daily refresh for cash and debt tiles to manage liquidity, weekly updates for operating KPIs like revenue and margins, and a monthly full consolidation for board packs. This cadence balances timeliness with stability, while audit trails capture who changed what and when.
How do I treat intercompany sales so that group revenue is not overstated?
Identify counterparty transactions between entities, record them in designated intercompany accounts, and eliminate 100 percent at the consolidation layer. Set automated rules that detect mirrored invoices and credit notes, and reconcile timing differences. AI-driven systems like AI Accountant can auto-tag and eliminate these entries during aggregation.
What is the recommended approach for multi-currency consolidation across USD and INR entities?
Define a single source for FX rates, apply consistent rate timing policies, and convert entity ledgers to the reporting currency before consolidation. Store both local and reporting currency values to support audit trails. Automate FX application to avoid manual errors and ensure comparability period over period.
Can I restrict regional managers to see only their entities without creating separate dashboards?
Yes, implement row-level security with role-based permissions so the same dashboard filters content by user access. Users see only authorized entities when switching orgs. See patterns in row-level security for finance dashboards, and consider tools like AI Accountant that support this by design.
How do I align entities on revenue recognition to make margin comparisons fair?
Publish a group accounting policy, select a single basis for revenue recognition, and implement pre-close checklists that validate key accounts. Use exception reports to flag unusual cut-offs and automate accruals where required. Consolidation systems that enforce policy mappings reduce manual reconciliation during quarter-end.
What KPIs should be on each entity tile for a quick health scan?
Include revenue, margin percentage, cash balance or runway days, payables, receivables, DSO, DPO, and overdue counts. Add variance versus budget and simple trend lines. Provide drill-downs to invoices and bills so users move from signal to source instantly. AI-powered platforms like AI Accountant ship with these tiles preconfigured for multi-entity use.
How do I catch round-tripping or circular fund movements between entities?
Set rules that flag reciprocal transfers within short windows, repeated patterns between the same pairs, and movements lacking underlying invoices or contracts. Combine rules with approvals for intercompany journals. Reporting tiles that show net positions by entity pair with aging buckets help surface anomalies quickly.
What documentation do auditors expect for intercompany eliminations in a consolidated close?
Maintain mappings of entity relationships, a log of identified intercompany transactions, elimination entries with references to source documents, and evidence of timing reconciliations. Store before and after consolidation snapshots. Automated audit trails from systems like AI Accountant streamline these requests.
As a CA handling multiple client groups, how can I scale dashboards without rebuilding from scratch each time?
Template your standard chart of accounts, KPI dictionary, and tile layouts, then apply them to each client with minor adjustments. Use ingestion and mapping libraries that learn by entity and reuse configurations. With AI Accountant, multi-org templates accelerate go-lives while preserving customizations per client.

Rohan Sinha is a fintech and growth leader building aiaccountant.com, focused on simplifying accounting and compliance for Indian businesses through automation. An IIT BHU alumnus, he brings hands-on experience across 0 to 1 product building, growth, and strategy in B2B SaaS and fintech.