Key takeaways
- An AR and AP health dashboard gives your finance team a single, real time view of receivables, payables, and forward looking cash position, replacing month end surprises with daily control over working capital.
- Role based design matters: partners and CFOs see daily summaries, collectors and AP staff get task level views with drill downs, alerts, and escalation triggers that drive action, not just awareness.
- Tracking overdue trends with roll forward logic and measuring collector productivity against clear SLAs (PTP kept rates, cash collected versus target) turns collections from guesswork into a repeatable process.
- A cash impact view that merges expected AR collections, scheduled AP payments, and statutory outflows like GST exposes liquidity risk before it becomes a crisis, with best case and base case scenarios side by side.
- Standardizing masters, aging logic, and KPI definitions across entities, then automating data ingestion from Tally and bank statements, eliminates the manual reconciliation bottleneck that delays most dashboards.
- Many CA firms and SME finance teams still build these views manually in spreadsheets. AI Accountant's MIS reporting and dashboard automation handles the heavy lifting, from data ingestion to real time overdue tracking, so your team focuses on decisions instead of data entry.
AR and AP Dashboard Automation: What's New in 2026
The biggest shift for AR and AP dashboards in 2026 is the expansion of mandatory e-invoicing. Until March 2025, the GST e-invoicing threshold sat at ₹5 crore aggregate turnover. From April 2025, it dropped to ₹1 crore, pulling a significantly larger pool of SMEs into the e-invoicing net. As per CBIC notifications on e-invoicing thresholds, this means every vendor bill and customer invoice now carries a structured IRN (Invoice Reference Number) that dashboards can validate automatically, improving data quality for both AR aging and AP matching.
The operational impact is direct. AP teams must now verify IRN validity before booking any purchase invoice, adding a checkpoint that did not exist for sub ₹5 crore suppliers a year ago. AR teams benefit because structured invoice data flows into GSTR-1 automatically, reducing reconciliation gaps between books and GST returns. Firms still running manual AP workflows face rejected input tax credit claims and potential penalties under GST portal compliance rules if e-invoice validation is skipped.
Who feels this most? SMEs with turnover between ₹1 crore and ₹5 crore, especially those on Tally without automated bill ingestion. CA firms managing 20 or more such clients now need multi entity dashboards that flag missing IRNs across all client books in one view.
The cost of inaction is concrete: blocked ITC claims, 5% to 18% GST payable from own pocket on missed credits, and late filing interest at 18% per annum. If your GSTR-2B reconciliation is still a month end spreadsheet exercise, the risk compounds every filing cycle.
What to do now:
- Audit all vendor masters for e-invoice compliance status before the next GST filing deadline.
- Set up automated IRN validation as a pre-approval checkpoint in your AP workflow.
- Ensure your dashboard flags GSTR-2B mismatches in real time, not at month end.
Platforms that automate bank statement ingestion and vendor bill matching against e-invoice data are becoming essential for firms that want clean dashboards without manual cross-checking.
Table of contents
What is an AR and AP Health Dashboard?
An AR and AP health dashboard is your financial cockpit. It is a real time display that pulls KPIs, trends, alerts, and summaries directly from ERP systems like Zoho Books or Tally.
Unlike static monthly reports, this dashboard delivers dynamic, role based views with drill downs and automation. It watches three areas: AR, AP, and their cash impact, giving timely visibility for confident decisions.
Stop reacting at month end. Start steering cash daily with clear, actionable visibility.
Must Have Dashboard Widgets
Your AR section needs several key widgets. Start with DSO (Days Sales Outstanding) to track collection efficiency. Add aging buckets to segment receivables by due status. Monitor overdue trends to spot risk early.
Track collector productivity through contacts made, PTP (Promise to Pay) kept rates, and cash collected versus targets. Maintain a dispute tracker for contested invoices.
The AP section mirrors this discipline. Use aging analysis for payables. Add a vendor payment schedule showing due versus overdue items and early payment discount opportunities. Include a dispute tracker for GSTIN mismatches or quantity variances.
The cash view ties it together. Show expected collections, scheduled payments, and statutory outflows like GST. This produces a unified liquidity forecast.
- Update cadence: partners and CFOs need daily high level summaries. Collectors and AP staff need multiple updates per day.
- Role based views: keep focus tight. Not everyone needs everything. Give drill downs where needed.
Further reading: Accounts Receivable Dashboard guide, Accounts Payable Dashboard guide.
AR Module, Focus Areas and Design
Tracking Overdue Trends Effectively
Use roll forward logic to track the movement of overdue receivables across buckets. The formula is simple: opening overdue plus new overdues minus collections and credit notes equals closing overdue by bucket.
Read patterns closely. Spikes may indicate customer concentration risk. For example, when more than 20 percent of overdues come from one customer, that is a red flag. Set alerts when DSO worsens. If your 60 plus days bucket grows by 15 percent month over month, notify the team immediately.
Trends reveal trajectory, not just position. They are your early warning system.
Measuring Collector Productivity
Go beyond activity counts. Connect effort to outcomes. Track these metrics:
- Contacts per day
- PTPs logged and kept (aim for 80 percent kept as SLA)
- Cash collected versus target
- Accounts touched
Use correlation views to link activity to DSO reduction. Break down performance by collector and region so comparisons respect portfolio context.
Managing the AR Dispute Tracker
Capture reason, disputed amount, owner, target resolution date, and status aging. Define escalation rules. For example, disputes unresolved beyond 15 days should escalate automatically.
Exclude disputed amounts from standard DSO. Keep them visible with separate dispute aging. This gives you a clean DSO number while still maintaining full transparency on contested invoices.
Helpful resources: ICAI guidance on receivables management and disclosure.
AP Module, Focus Areas and Design
Building Your Vendor Payment Schedule
Start with approved bills, due dates, payment terms, early discount availability, and GST related holds. Create a priority logic that scores each payment obligation. Weight due date urgency at 40 percent, penalties and discount opportunities at 30 percent, vendor criticality at 20 percent, and cash availability at 10 percent.
Produce a weekly payment batch plan. Show totals, capture approvals, and track execution against the plan.
Setting Up the AP Dispute Tracker
Log GSTIN mismatches, quantity variances, and pending GRN (Goods Receipt Note) confirmations. Track aging and SLAs. Aim for 90 percent resolution within 7 days.
Monitor root causes. Repeat GSTIN issues usually indicate master data gaps that need fixing at the source. Remember, disputes affect AP aging accuracy and vendor trust.
Adding the Compliance Layer
Integrate GST controls into your AP workflow. Build checkpoints for GSTR-2B matching to prevent payment holds. Treat journal vouchers and credit notes separately from bills for accurate aging in Zoho Books or Tally.
Validate input tax credit (ITC) eligibility prior to approval to avoid filing surprises. With the expanded e-invoicing mandate, IRN validation is now a critical pre-approval step for most vendors.
More guidance: AP dashboard practices.
Cash Impact View, Bringing AR and AP Together
The cash impact view rolls up expected AR collections, scheduled AP payments, statutory outflows, and internal transfers into daily and weekly liquidity bands.
Build best case and base case scenarios. Best case assumes all PTPs are kept and payments arrive on time. Base case applies historical collection rates and realistic delays. The gap between the two exposes your risk exposure.
Make it actionable:
- Show forecast variance as percentage deviation from plan
- Display covenant buffers for bank facilities
- Use working capital utilization indicators
Decisions become clearer. Whether to draw on an overdraft facility, capture early payment discounts, or sweep cash from subsidiaries, the data guides you.
Data Design and Build, How to Implement the Dashboard
Identifying Data Sources
Pull masters and transactions from Zoho Books or Tally. Import bank statements for payment matching. Download GSTR-2B for GST reconciliation. Ingest email attachments for vendor bills where required.
Building the Data Model
Standardize customer and vendor codes across entities. Normalize ledger names and state codes for GST.
Calculate aging correctly. Due date equals invoice date plus payment terms. Compare against receipt date. Adjust for partial payments, credit notes, and advances.
Map bank narrative patterns. Link common descriptions to the right party or invoice. For example, "NEFT from ABC Corp" matches to ABC Corporation receivables automatically.
Establishing Governance Rules
Define KPIs centrally. Agree on DSO definitions (total sales or credit sales) and ensure consistency across all entities.
Set refresh frequencies. Transactions should sync at least daily. Master data should refresh weekly unless onboarding is frequent.
Create role based access controls. CEOs see consolidated multi entity views. Regional managers see their territories. Collectors see their assignments. This prevents overload and protects confidentiality.
Operating Rhythms and Playbooks
Daily AR Huddles
Run a focused 15 minute standup. Review overnight collections against promises. Check overdue movements. Unblock big accounts. Assign same day follow ups.
Keep deeper issues for separate sessions to avoid drift.
Short, sharp cadences sustain momentum. Long meetings drain energy.
Weekly AP Committee Meetings
Every Monday, review proposed payment schedules against cash. Approve or defer. Document reasons and new target dates. Track vendor escalations and disputes.
Cross Functional Dispute Reviews
Meet bi-weekly across sales, procurement, and finance. Tackle aged AR disputes with sales for customer context. Address AP disputes with procurement for vendor leverage.
Track commitments with dates and owners. Build accountability into the cadence.
Month End Checklist Integration
Use the dashboard to verify cut offs. Confirm GST reconciliation. Ensure disputes are excluded from standard aging. Review collector productivity versus monthly targets.
Automate validations where feasible to reduce manual effort and shorten your month end close cycle.
Key KPIs and Formulas, Quick Reference Guide
Essential AR Metrics
- DSO (Days Sales Outstanding): AR balance divided by credit revenue, multiplied by number of days. Example: AR ₹45 lakhs, monthly credit revenue ₹30 lakhs, DSO = 45 days.
- CEI (Collection Effectiveness Index): [(Beginning AR plus Credit Sales minus Ending AR) divided by (Beginning AR plus Credit Sales minus Disputed AR)] times 100. Aim above 90 percent.
- Overdue percentage: overdue AR divided by total AR. Example: ₹15 lakhs overdue out of ₹45 lakhs total equals 33 percent.
- Collector productivity: contacts per day (20 to 30 is typical), PTP kept rate at 80 percent, cash collected versus target (aim for full attainment by day 25).
Critical AP Metrics
- Due versus overdue percentage: overdue AP divided by total AP. Keep under 10 percent.
- Discount capture rate: captured discounts divided by eligible discounts, times 100. Target above 70 percent.
- Average approval lead time: total approval days divided by bills. Anything beyond 3 days indicates bottlenecks.
Cash Impact Indicators
- Forecast variance: (Actual minus Projected) divided by Projected. Beyond 10 percent implies calibration is needed.
- Liquidity runway: available cash divided by average daily burn. Below 30 days requires immediate action.
- Working capital days: DIO plus DSO minus DPO. Reduce without harming vendor relationships.
Practical Aging Buckets and Scoring
Use standard buckets: Current, 0 to 30, 31 to 60, 61 to 90, and 90 plus. Adjust for your terms. For example, use 0 to 45, 46 to 75 if you offer 45 day payment terms.
Vendor priority scoring: (Days until due × 0.4) + (Penalty risk × 0.3) + (Vendor criticality × 0.2) + (Cash availability × 0.1). Lower scores get paid first.
Dispute SLA tracking: trigger escalation beyond 7 days. Aim for 90 percent resolution within SLA.
References: ICAI standards and guidance on financial reporting, AR KPI references.
Example Dashboard Layouts, Practical India Context
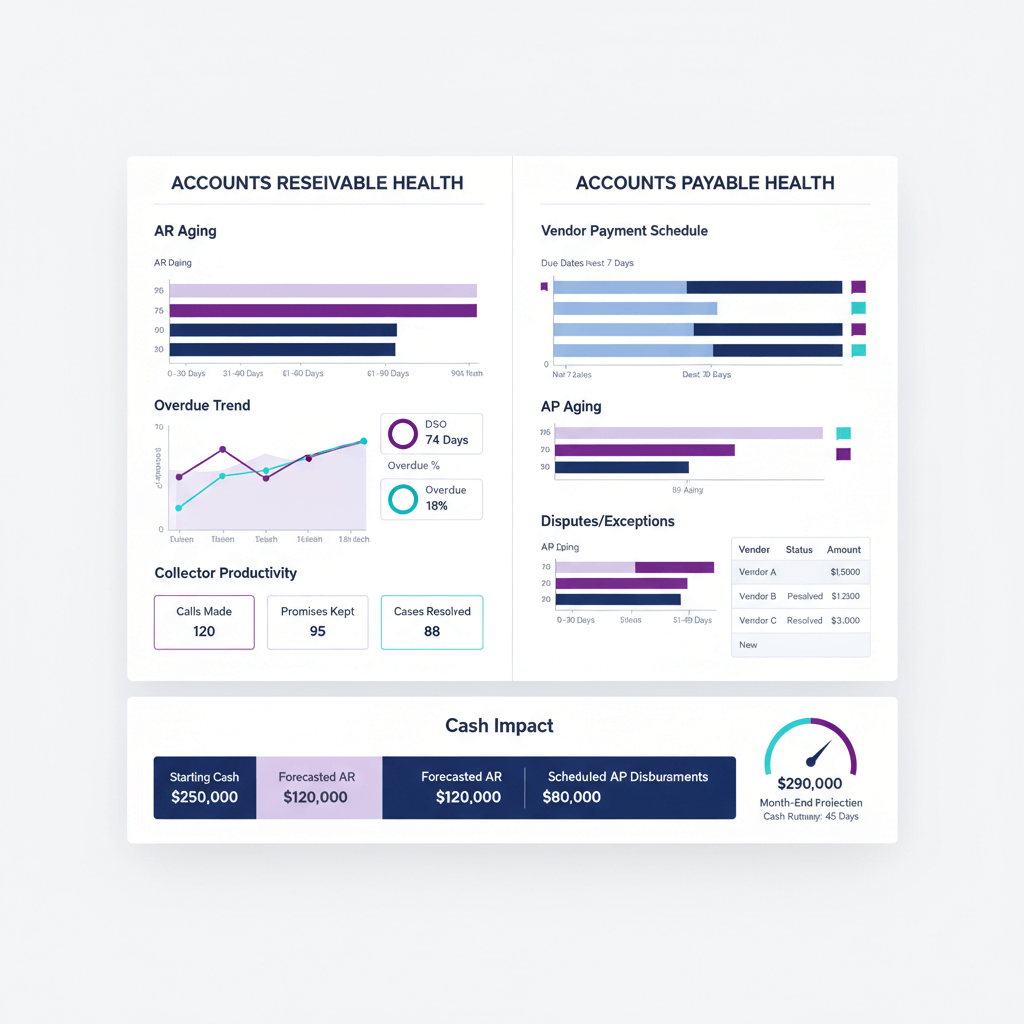
SME Manufacturing Company Case Study
Pune based manufacturer, revenue ₹35 crores, Tally Prime, 2 collectors and 1 AP executive.
The AR summary shows a 15 percent spike in the 31 to 60 days bucket after Diwali. Collector A keeps 85 percent of PTPs with 22 daily contacts. Collector B keeps 70 percent while handling larger accounts. DSO sits at 52 days against a 45 day target.
AP summary shows ₹18 lakhs due this week. ₹2.5 lakhs is eligible for 2 percent early discount. Disputes total ₹2 lakhs due to GSTIN mismatches across 3 vendors, averaging 5 days aging.
Cash view projects 6 weeks ahead. Week 1 inflows are ₹25 lakhs versus outflows of ₹18 lakhs. By week 6, cumulative collections reach ₹1.5 crores against payments of ₹1.2 crores. Runway stays steady at 45 days.
Before and After Impact
After adopting the dashboard, DSO drops from 52 to 42 days in three months. Overdue percentage reduces by 25 percent. Early discount capture rises from 40 percent to 85 percent, saving ₹3.6 lakhs annually.
Month end closure time falls from 10 to 6 days. Finance overtime drops 40 percent. Leadership gains continuous cash visibility instead of waiting for month end reports.
CA Firm Managing Multiple Clients
Chennai based CA firm with 30 SME clients uses a multi entity dashboard. Consolidated AR is ₹12 crores with drill downs by client.
Each client has specific thresholds. Retail targets 30 day DSO. Projects businesses accept 60 days. Dispute categories are standardized across all clients. Analysis shows 40 percent of disputes driven by GST rate confusion, enabling targeted client education.
How Technology Platforms Support AR/AP Dashboards
Choosing the Right Tools
- AI Accountant: automates ingestion of bank and card statements, normalizes transactions for invoice matching, posts to Zoho Books or Tally with GSTIN validation, and builds real time AR and AP dashboards with overdue tracking, collector productivity, and cash forecasts across entities. ISO 27001 and SOC 2 Type II certified.
- QuickBooks: built in dashboards with standard aging and basic customization, suitable for small businesses.
- Xero: clean dashboards with mobile access. Advanced analytics typically require add ons.
- FreshBooks: simple dashboards for small businesses and freelancers, with limited multi entity capability.
- Zoho Analytics: deep integration with Zoho Books for custom dashboards. Some technical effort required for advanced setups.
Integration Capabilities
Modern platforms streamline data integration. AI Accountant syncs masters from Zoho Books and Tally, processes normalized data, and writes cleaned results back, eliminating manual entry.
It ingests PDFs, Excel, and scanned images. It extracts relevant fields automatically. It handles splits, internal transfers, and complex GST reconciliations.
CA firms benefit from multi entity support. Switch between clients without re-login. Maintain org specific learning. Generate consolidated views easily.
Best Practices and Common Pitfalls
Data Hygiene Fundamentals
- Deduplicate masters, standardize names, validate GSTINs, and maintain consistent coding across entities.
- Run weekly GSTR-2B reconciliation. Reduce mismatches early. Lower filing pressure.
- Enforce PTP logging after every collection interaction. Otherwise, productivity metrics lose meaning.
- Require approval workflows for exceptions. Payment priority overrides or unusual credit terms should be documented with clear audit trails.
Pitfalls to Avoid
- Do not rely only on static aging. Trends matter. Position without trajectory hides brewing risk.
- Avoid focusing on collections alone. Measure activity and outcomes, or collectors will cherry pick easy accounts.
- Do not hide disputes by excluding them entirely from aging. Age them separately and visibly.
- Start simple, expand as adoption grows. Better a simple dashboard used daily than a complex one ignored.
- Use dashboards to surface issues. Then apply judgment and context before action.
FAQ
How is an AR and AP health dashboard different from an MIS pack that CAs share monthly?
An AR and AP health dashboard is real time and interactive, while MIS packs are static, backward looking PDFs. The dashboard provides drill downs, automated alerts, and role based views that let you click an overdue number to see constituent invoices, disputed items, and PTP commitments, then trigger tasks immediately. With the 2026 e-invoicing expansion, dashboards also validate IRN data automatically, something a monthly PDF cannot do (2026 update).
For a CA firm, what data refresh cadence is practical without overloading systems?
Daily transaction refresh is the minimum for AR and AP. Master data should refresh weekly unless onboarding is frequent. Critical widgets like overdue trends and cash impact should refresh multiple times per day for collection and AP teams. Schedule sync windows during off peak ERP hours to avoid performance issues.
How do I set up overdue trend roll forward in Tally extracts?
Build opening overdue by bucket from the prior day. Add new invoices entering overdue status. Subtract collections and credit notes. This gives you closing overdue. Always use invoice due date, not document date, and handle partial receipts accurately. Many teams use templates that compute bucket movements and variance flags automatically.
How should a vendor payment schedule be prioritized when cash is tight at month end?
Score each bill using a transparent weighted model: due urgency at 40 percent, penalties or discounts at 30 percent, vendor criticality at 20 percent, and cash availability at 10 percent. Approve weekly batches based on cumulative score. Highlight early payment discount opportunities, such as 2 percent on critical suppliers, because missed discounts are a hidden cost.
How do I track AR and AP disputes without corrupting DSO and aging reports?
Maintain a separate dispute ledger with fields for reason, disputed amount, owner, target resolution date, and aging. Exclude disputed amounts from standard DSO but keep them visible in dispute aging. This gives leadership a clean DSO number while ensuring no disputed invoice falls through the cracks.
What GST controls should sit inside AP workflows to prevent payment errors?
Embed GSTR-2B matching checks, verify ITC eligibility, validate IRN for e-invoice compliance, and separate journal vouchers and credit notes from standard bills. Trigger holds when GSTIN mismatches occur. With the ₹1 crore e-invoicing threshold now in effect, IRN validation is mandatory for most vendor invoices (2026 update).
What minimum viable dashboard should a new SME client start with before scaling?
Begin with AR aging, overdue trends, and a simple AP payment schedule. These three views cover the biggest visibility gaps. Add dispute tracking and cash impact next. Once adoption is steady, expand to collector productivity, compliance dashboards, and multi entity consolidation.
Taking Action, Your Next Steps
You do not need perfection to start. Pick the biggest visibility gap, whether that is overdue trends or vendor payment scheduling, and get that working well first.
Document current processes: collector call tracking, AP dispute logging, and management reports used today. Then identify quick wins.
Check data readiness. Clean masters. Extract aging reliably. Standardize categorization across entities.
Choose technology aligned to your complexity. Excel works for simple cases. Automation platforms become essential as your organization or client base grows.
Involve the team early. Collectors, AP staff, and leadership should all have input so the dashboard reflects real workflows and priorities.
Remember: the goal is not prettier reports. It is a shift from reactive firefighting to proactive cash management. When you can answer "What is our cash position?" anytime, with confidence, your AR and AP health dashboard is doing its job.

Rohan Sinha is a fintech and growth leader building aiaccountant.com, focused on simplifying accounting and compliance for Indian businesses through automation. An IIT BHU alumnus, he brings hands-on experience across 0 to 1 product building, growth, and strategy in B2B SaaS and fintech.