-01%201.svg)
Key takeaways
- A customer profitability dashboard reveals which customers create value, and which quietly destroy margins, enabling precise, data driven decisions.
- Focus your core view on contribution margin, not fully loaded costs, this preserves unit economics for pricing, product mix, service scope, and credit actions.
- Track revenue concentration, product margin analysis, service line profitability, and payment behavior, then convert insights into an action list with owners and due dates.
- Refresh monthly, watch trends over 3, 6, and 12 months, and use governance rhythms to keep improvements on track.
- Small, fast moves work, price corrections, scope resets, tighter payment terms, mix optimization, and in some cases, a planned customer exit.
Customer profitability, the dashboard that lifts margins
Ever wondered why revenue rises while margins stay flat, the answer usually sits in your customer mix. Some relationships demand custom packaging, extended terms, and frequent service hours, others buy standard products and pay quickly. A disciplined customer profitability dashboard separates signal from noise, then guides actions that move the needle.
What customer profitability really means
Customer profitability goes beyond sales per customer, it measures net gain after every relevant cost. Start with realized revenue, after rebates and returns, then calculate gross margin by deducting cost of goods sold. Go deeper to contribution margin, subtract variable service costs, support time, special delivery, and payment processing fees. Use fully loaded margin sparingly for long range strategy, contribution margin is your operational workhorse.
The key insight is simple, two customers with identical revenue can have dramatically different margins, one supports growth, the other erodes it.
For background reading, see customer profitability analysis, benefits, and formulas, customer profitability overview, customer profitability analysis guide, and profitability analysis, a comprehensive guide.
Data you need, and how to prepare it
Pull sales invoices, credit notes, discounts, and returns, mapped to customers and products or services. Add cost data for accurate margins, include landed costs for product analysis, and time logs or support tickets for service lines. Do not ignore cash flow, capture payment terms, actual collection periods, and fees, link DSO to profitability, a customer paying in ninety days costs more than one paying in fifteen.
Master data hygiene matters, unique customer IDs, consistent naming, correct tax treatment. Reconcile thoroughly, freight and packing often sit outside COGS, tax inclusive pricing can blur margins, credit notes get overlooked. A pharma distributor discovered transport costs were excluded, several hospital chains flipped from profitable to break even, pricing conversations followed quickly.
Further reading, customer profitability primer and benefits and how to guide.
Core metrics and formulas to feature
- Customer level views, realized revenue, growth, gross margin and contribution margin in amounts and percentages, return rates, discount percentages, price realization versus list, DSO and payment fees.
- Product margin analysis, margins by SKU per customer, mix effects, landed costs, freight and duties included, spotlight low margin drags.
- Service line profitability, actual hours versus contracted, effective hourly rates, overruns flagged, a CA firm often finds poor records double the effort.
- Revenue concentration, share of revenue and margin from top five and top ten customers, cumulative curves, simple indices like the Herfindahl Hirschman Index for quick scores.
- Loss making customers, negative contribution for three consecutive months, thresholds like below ten percent margin, separate chronic issues from temporary investments.
- Trend tracking over 3, 6, and 12 months, margin percentage, price realization, and payment behavior, link to customer credit scoring.
Explore perspectives in customer profitability analysis, profitability by customer, profitability analysis guide, customer profitability analysis for operations, and what is customer profitability analysis.
Recommended dashboard layout
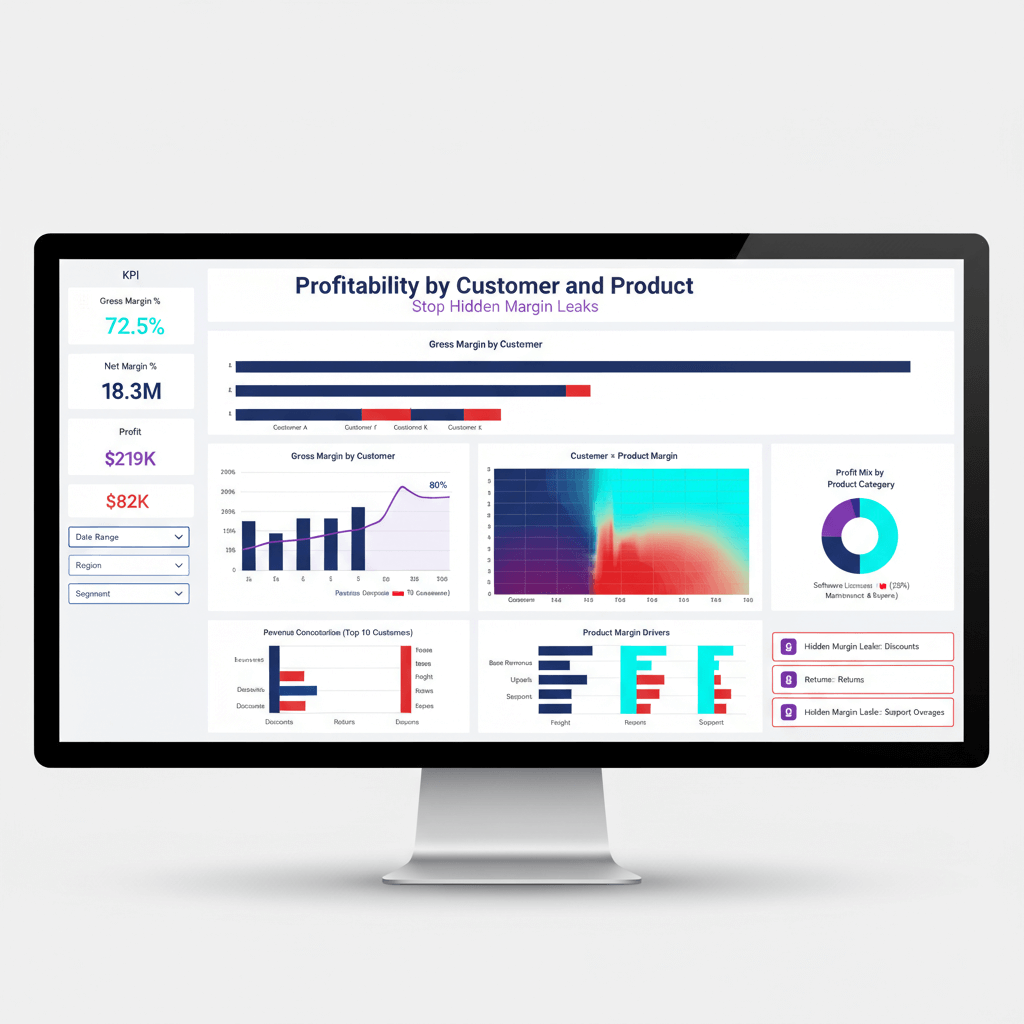
Start with executive tiles, total revenue, average gross margin percentage, count of loss making customers, top ten concentration, at risk margin in rupees. Use a waterfall from revenue to contribution margin, a Pareto for revenue concentration, heatmaps for customers by SKU, and by service, a scatter with margin percentage versus DSO, bubble size for revenue.
Enable drilldowns, customer profiles with invoices, discounts, product mix, service effort, and payment patterns, product and service drilldowns across cohorts. Keep the layout clean and logical, users should see status in seconds and know where to click.
Helpful examples, client profitability dashboard, sample customer profitability in Power BI, and customer profitability analysis foundations.
Segmentation and filters
Use geographic, industry, and channel cuts, separate new from existing customers, include contract types, and service plan tiers. Time filters for month to date, quarter to date, year to date, plus trailing 3, 6, and 12 month views. Make filters combinable, answer questions like, which manufacturing customers in North India on annual contracts show declining margins.
See customer profitability segmentation and segmentation in profitability analysis.
Turning insights into an action list
A dashboard only creates value when it drives actions. Automate an action list with recommendations, owners, and due dates. Price increases for loyal, low margin customers, discount reduction where volume does not rise, product mix optimization toward higher margin SKUs, service scope resets for overruns, tighter terms for slow paying, low margin customers, and planned exits for chronic loss makers.
- Prioritize using impact versus effort, quick wins first.
- Set 30 day targets, assign owners, track completion and impact.
Reference ideas in profitability action planning, profitability improvement strategies, and operational actions from analysis.
Workflow and governance
Set rhythms that stick, monthly reviews for early issues, quarterly deep dives for product and service lines, annual portfolio decisions. Define thresholds, target gross margin like thirty percent, minimum contribution margin like ten percent, concentration limits for top ten customers, alerts when limits break. Create playbooks, price changes, term renegotiations, service model shifts, and customer exits. Assign accountability, sales for pricing and contracts, operations for delivery efficiency, finance for payments and collections, leadership for portfolio calls.
Governance resources, profitability analysis governance.
Step by step build guide
Start in your accounting system, clean master data, standardize products and services, units of measure, and tax treatment. Export six months or more of invoices, payments, credit notes, costs, and service logs. Move to your analysis platform, sync data, normalize formats, tag products and services accurately, map costs, reconcile exceptions, then build views in this order, concentration risks, service lines, product margins, and loss making flags.
Consider tools like AI Accountant for native integrations with Zoho Books and Tally, or build with Power BI, Tableau, or Google Data Studio. Test calculations against known examples, validate filters, confirm drilldowns, and ensure action rules catch real issues.
Useful references, customer profitability workflows, client profitability dashboard example, and sample report in Power BI.
Example walkthrough
An electronics distributor saw revenue up, margins stuck at twelve percent. The dashboard revealed eight customers driving sixty percent of revenue but only forty percent of margin, the largest account concentrated in a commoditized SKU at eight percent margin, and distant deliveries that lost money after freight and delays. Actions followed, a fifteen percent price increase for distant shipments, logistics consolidation, tighter terms from sixty to thirty days for customers below ten percent margin, and a handling fee for custom packaging. Within sixty days, margins rose three and a half percentage points, concentration fell as smaller profitable accounts grew, and cash flow improved with faster collections, with weekly reviews keeping momentum strong.
For similar transformations, see profitability analysis case approaches and operational lessons from customer profitability analysis.
Quality checks, common mistakes to avoid
- Include landed costs in product margins, freight, customs, and handling, otherwise margins get overstated.
- Avoid heavy overhead allocations in operational views, keep contribution margin clean.
- Separate one off onboarding costs from ongoing service delivery.
- Treat refunds consistently, document your policy.
- Look at margin concentration alongside revenue concentration.
- Factor payment terms into profitability, long DSO consumes working capital.
- Update cost data quarterly at minimum, input prices and service efficiency change.
Read more in customer profitability analysis pitfalls and profitability analysis best practices.
KPIs to track improvement
- Count of loss making customers, target a fifty percent reduction in six months.
- Bottom quartile margin improvement, moving from five percent to twelve percent changes outcomes.
- Revenue concentration, reduce top ten share below forty percent while maintaining growth.
- Action list closure and impact, aim for eighty percent completion and seventy percent success.
- Service line efficiency, hours per ticket down twenty percent through better documentation.
- Product mix shifts toward higher margin SKUs, measured monthly.
- Cash flow gains from DSO reductions, working capital released with even five days improvement.
Benchmark ideas, profitability analysis KPIs and operational KPIs from customer profitability.
Next steps
Start with your five largest customers, calculate contribution margins manually, expect surprises, then build a simple dashboard, revenue and margins first, product and service lines next, do not wait for perfect data. Create a thirty day action list, three pricing changes, two term tightenings, one potential exit, measure outcomes to build confidence. Link customer profitability to receivables, pricing, and service delivery, share wins broadly to grow buy in. Markets shift, costs move, needs evolve, your dashboard gives the visibility to adapt quickly and keep margins healthy.
FAQs
How do I compute customer level contribution margin in Tally or Zoho Books without overhead distortions, and what should I include?
Include realized revenue after rebates and returns, deduct COGS with landed costs, then subtract variable service costs, support time, special delivery, and payment processing fees, exclude rent and admin salaries. If you need a fast setup, AI Accountant connects to Zoho Books and Tally, maps invoices, credits, and costs, and outputs contribution margins by customer.
What is the correct DSO calculation for profitability linkage, and how should I place it on the dashboard?
DSO equals accounts receivable divided by average daily sales, view it alongside margin percentage and bubble sized revenue in a scatter. Customers with high revenue, low margin, and long DSO deserve immediate credit term tightening. For a template, use the accounts receivable automation playbook to link DSO and collection workflows.
How should I treat bundled products and services in margin analysis, especially when GST and discounts vary by component?
Either apportion bundle revenue by a standard mix ratio, or track bundles as separate SKUs with dedicated cost and margin logic, ensure GST treatment is consistent with bundle definitions. AI Accountant supports bundle tagging and margin computation so you do not lose visibility when products and services are combined.
What thresholds should I set for revenue concentration, and how do I monitor margin concentration alongside it?
Keep top ten customer revenue share below forty percent, and track margin share as well, since a customer contributing thirty percent of revenue but fifty percent of margins presents different risk. Use a Pareto curve and the Herfindahl Hirschman Index for quick scores, place both revenue and margin curves on your executive view.
Should I allocate overheads to customers, or rely on contribution margin for operational decisions?
Rely on contribution margin for operational decisions, it reflects the incremental economics that pricing, scope, mix, and credit actions can change. Use fully loaded margin for strategic decisions only, entering new markets or major capability investments. Keep your dashboard centered on contribution margin for clarity.
How do I identify loss making customers reliably, and what action sequence works best for correction?
Flag customers with negative contribution for three consecutive months, then apply an action sequence, price increase, scope reset, mix optimization, tighter payment terms, and if needed, an orderly exit. AI Accountant can auto generate lists based on rules, for example, below ten percent margin and DSO above target, then push tasks to your tracker.
What is the recommended way to capture landed costs by SKU for accurate product margin analysis in an Indian GST environment?
Attach freight, customs, handling, and other logistics to the SKU level through cost worksheets, reconcile against purchase entries, and update quarterly at minimum. Do not leave these costs outside COGS, margins will be overstated. A heatmap of customers by SKU will immediately show where landed costs convert a profitable SKU into a loss.
How should seasonal customers be treated in analysis, and how do I avoid wrong conclusions when off season periods dilute margins?
Filter seasonal customers by active periods, compare season over season trends, and avoid annual averages that blur profitable seasons. Create separate views for seasonal segments, and track contribution margin during active months for accurate pricing, capacity, and service planning.
What governance framework works for price changes and credit term updates, and how do I ensure controls are respected?
Define approval tiers tied to margin gaps and DSO breaches, set documentation and communication templates, and log outcomes. Monthly reviews check progress, quarterly deep dives adjust thresholds. AI Accountant can trigger alerts when margin floors or DSO ceilings are crossed, then route price and credit actions to owners.
How do I reconcile credit notes, discounts, and returns, and prevent margin misstatement at the customer level?
Use a single reconciliation flow, match credit notes and returns to invoices, align discounts at line item level, and remove tax inclusive confusion by standardizing to net values. Run a monthly exception report, missing credits, freight outside COGS, or tax misclassifications. Your dashboard should only consume the reconciled dataset.
What visualization set gives the fastest executive read, and how do I arrange drilldowns for investigation?
Executive tiles first, total revenue, average gross margin, count of loss makers, top ten concentration, at risk margin, then a waterfall from revenue to contribution, a Pareto for concentration, heatmaps for product and service profitability, and a margin versus DSO scatter. Drilldown by customer to invoices, discounts, product mix, service usage, and payment patterns, drilldown by SKU and service to cohort performance.
Can AI Accountant integrate directly with Zoho Books and Tally, and what is the setup path for a working dashboard in weeks not months?
Yes, AI Accountant offers native integrations, it pulls invoices, payments, credits, products, services, and cost data, normalizes master data, and publishes customer, product, and service margin views. Typical setup includes data cleaning, rules for margin floors and DSO ceilings, action list automation, and scheduled refreshes, most teams go live within a few weeks.

Rohan Sinha is a fintech and growth leader building aiaccountant.com, focused on simplifying accounting and compliance for Indian businesses through automation. An IIT BHU alumnus, he brings hands-on experience across 0 to 1 product building, growth, and strategy in B2B SaaS and fintech.