-01%201.svg)
Key takeaways
- Automated board reporting in India pulls accurate data from Tally, Zoho Books, and QuickBooks, replacing manual spreadsheets and messy reconciliations.
- Executive summary dashboards, India ready templates, and investor updates get generated in hours, not days.
- Compliance stays visible, with GST, TDS, and ROC trackers, including alerts and links to filings for quick verification.
- Automation creates a single source of truth, boosting investor confidence, speeding decisions, and ending version control chaos.
- A practical 90 day plan gets you live with core KPIs, board packs, and investor updates, without building large internal data teams.
- Clear ROI for SMBs and startups, time saved, fewer errors, and faster closes usually pay back the investment within weeks.
- Consider a buy or hybrid approach for speed, then layer custom analytics as needed, while keeping costs predictable.
What is Board Reporting Automation in the Indian Context?
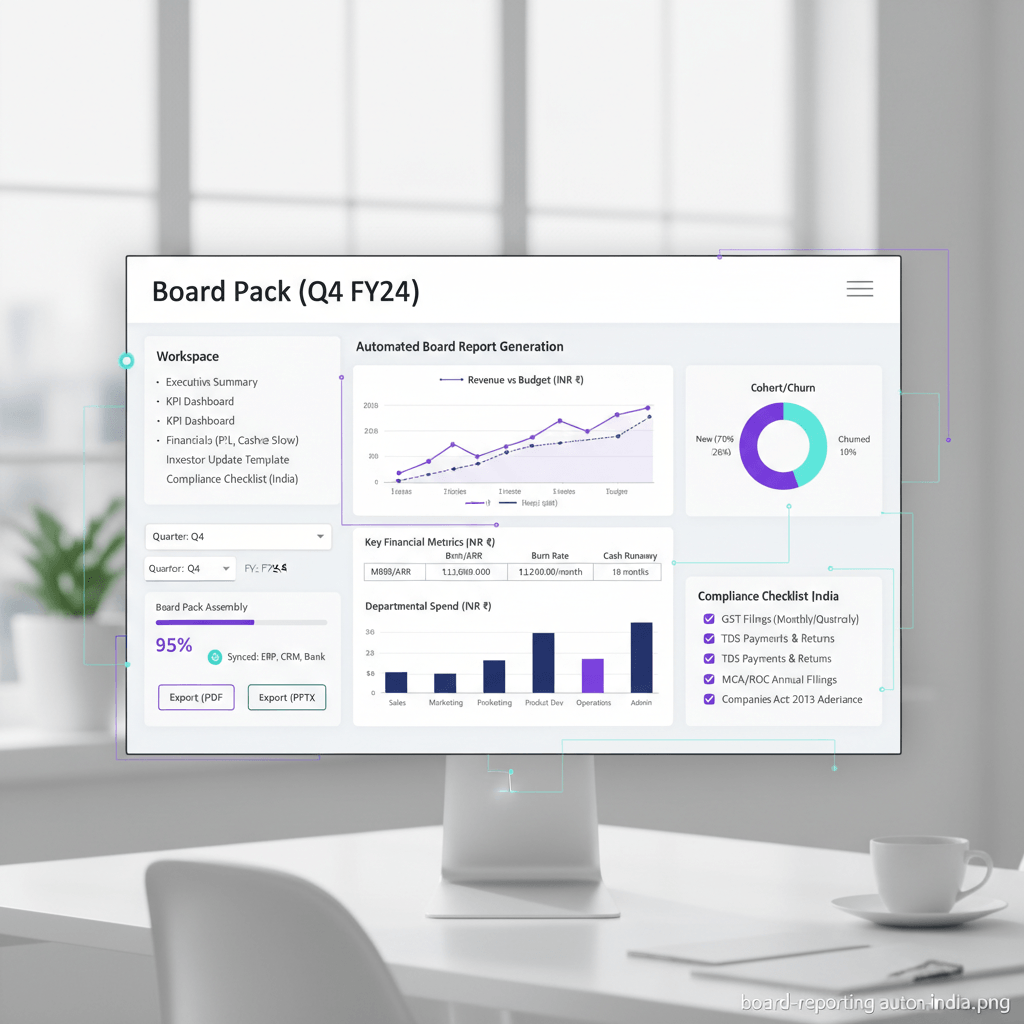
Think of automation as a finance assistant that never sleeps, continuously ingesting data from accounting, bank feeds, CRM, and even the GST portal, then computing KPIs like ARR, MRR, cash runway, and generating board ready narratives with AI prompts. One click exports push everything into board deck templates and investor update formats.
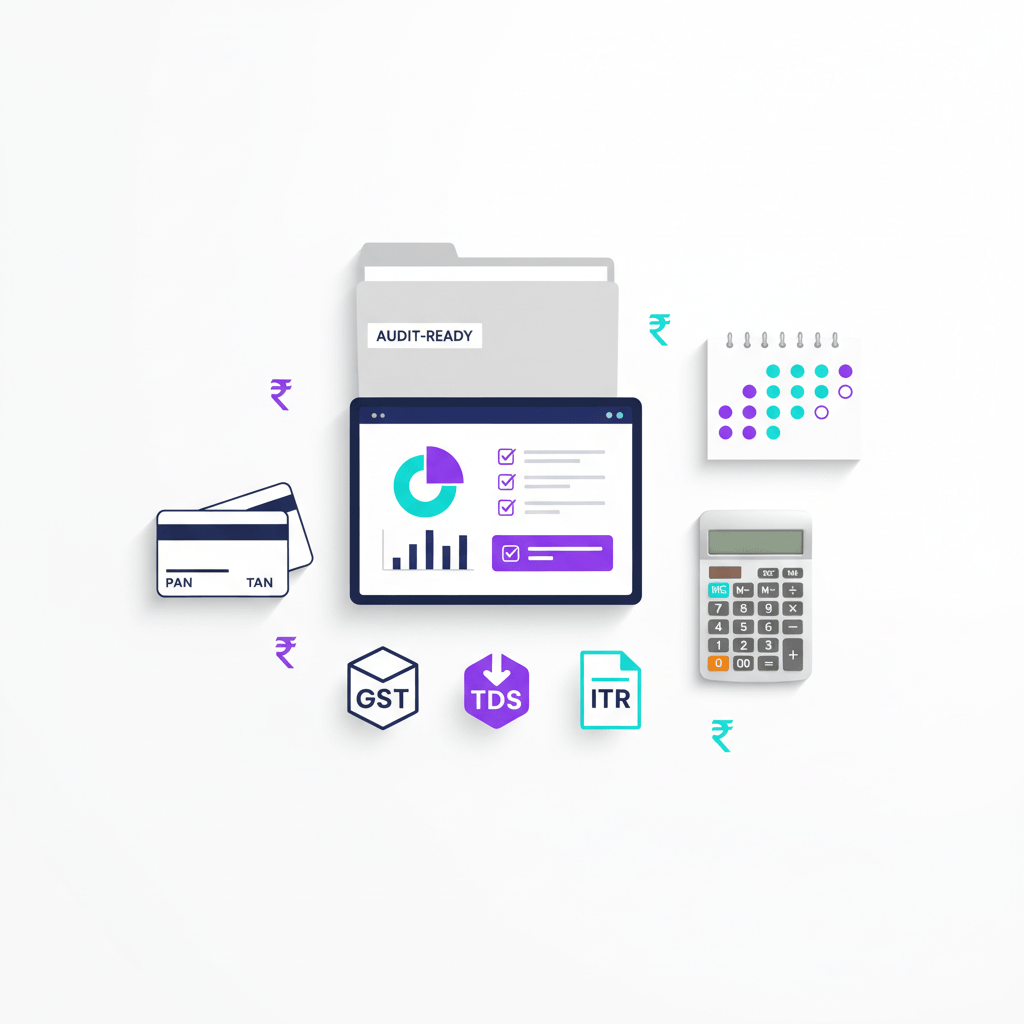
In India, local features matter. GST reconciliation runs automatically, pulling GSTR 1, 3B, and 9. TDS summaries appear without manual work. ROC snapshots update on their own. MIS packs reflect familiar AR and AP aging, aligned with MSME norms. The system connects to Tally ERP, Zoho Books, QuickBooks, and bank feeds from HDFC or ICICI, then links to GSTN for live compliance status.
A single source of truth cures conflicting numbers, late night spreadsheet hunts, and last minute scrambles before the board meets.
Core Outcomes and Benefits of Automated Board Reporting
- Speed: Preparation time drops from 3 to 5 days to 2 to 4 hours, so one focused afternoon replaces a lost week.
- Accuracy: Consistent numbers across every slide and report, elimination of formula errors, and end of version control nightmares.
- Investor confidence: Standardized investor updates and interactive dashboards signal rigor and reliability.
- Compliance readiness: Built in trackers monitor GST payable versus Input Tax Credit, TDS status, and ROC deadlines, so nothing slips.
- Team leverage: Finance escapes manual drudgery, founders focus on strategy, and board time shifts to growth decisions.
What a Strong Board Pack Includes: India Ready Checklist
Your executive summary dashboard anchors the pack, showing revenue and margin trends, EBITDA, cash runway, and burn. For SaaS, include ARR and MRR. Add India specific metrics, AR and AP aging for MSME norms, GST and TDS status, and ROC timeline tracking.
- Financial statements: P&L, balance sheet, cash flow, and budget versus actuals, with cohort and segment views where useful.
- Operating KPIs: SaaS, CAC to LTV, churn, expansion revenue. D2C, inventory turns, return rates, channel performance. Services, utilization, project margins, client concentration.
- Forward looking: Risks, hiring pipeline, sales funnel, product roadmap, all driving a planning conversation, not just a review.
- Appendices: Bank recs, key contracts, GST return copies, MCA filings, ready when needed, separated from the main flow.
Board Deck Templates: Structure and Automation Magic
Follow a clean flow. Title and agenda, executive summary dashboard, highlights and lowlights, financial performance, stage specific KPIs, cash and runway, compliance tracker, then initiatives and board asks.
- Highlights and lowlights: Three wins and three challenges, automation suggests, humans refine.
- Stage fit: Pre seed, show traction and product market fit signals. Growth stage, show unit economics and scalability. Mature, show profitability, quality of earnings, and market share.
- Cash and runway: Current balance, monthly burn, months left, with simple green, amber, red cues.
- Compliance view: GST, TDS, ROC, in a single tracker, linking to filings for quick checks.
- Customization: Drag and drop sections, add special topics, maintain brand consistency, all without reformatting every quarter.
Executive Summary Dashboard: What to Show and How to Automate
Display revenue and gross margin trends with targets, cash runway and burn prominently, and AR or AP aging buckets that reveal working capital pressure. Show GST reconciliation status against ITC, and TDS deducted versus deposited, with any notices flagged. Add an ROC calendar with countdowns for filings.
- Format: Sparklines for quick trend reads, consistent color semantics, comparative benchmarks where relevant, numbers big enough for video calls.
- Automation: APIs and scheduled pulls from accounting and CRM daily, bank feeds in real time, GST portal weekly or on demand, manual uploads for unique sources.
Tip: Keep 10 to 15 KPIs on the top dashboard, then link to deep dives, so executives see the narrative at a glance.
Quarterly Board Reports: Cadence and Workflow
- T minus 10 days: Soft close books, automation computes KPIs, flags variances.
- T minus 7 days: Review the auto draft, inject management commentary, loop in department heads.
- T minus 3 days: Functional reviews, sales pipeline, product delivery, hiring updates, qualitative context.
- T minus 1 day: Founder narrative and CA compliance sign off, lock the deck, share securely.
Ownership: Finance leads data integrity, the founder owns messaging, your CA validates compliance, automation coordinates the flow. Between quarters, monthly check ins and system health checks prevent surprises.
Investor Update Templates for Monthly and Quarterly Communication
Start with a crisp TL,DR, then a metrics table with current, previous, and change, followed by product or GTM progress, hiring, cash and runway, and clear risks or asks. Monthly stays short, quarterly adds context and competitive insights.
- Consistency: Pull metrics from the same sources, use identical definitions, and send on a predictable schedule.
- Actionability: Specific intros, advice requests, and resource asks drive investor engagement.
Tool and Service Evaluation Checklist for Board Reporting Automation in India
- Integrations: Tally, Zoho Books, QuickBooks, HDFC or ICICI bank feeds, GSTN portal, plus CSV fallback.
- Features: Executive dashboards, one click board packs, template libraries, role based access, audit logs.
- India compliance: GSTR 1, 3B, 9 views, TDS tracking, ROC or MCA integration.
- AI: Anomaly detection, variance explanations, narrative suggestions, forecasting.
- Security: Indian data residency, encryption at rest and in transit, SOC 2 or ISO 27001, pen testing.
- Pricing: Monthly per entity or transaction tiers, transparent, no hidden user fees.
- Support: Fast onboarding, CA aware support, clear SLAs.
- Red flags: CSV only, vague pricing, no local compliance, generic templates that need heavy edits.
Build vs Buy: Making the Right Decision
Build when you have unique KPIs, proprietary metrics, a strong internal data team, and patience for maintenance. Buy when you need standard reporting quickly, with predictable costs and limited finance bandwidth. A hybrid often wins, using platforms for finance and adding custom analysis in Sheets or a data notebook.
When the board cycle is this quarter, buying now, then adding custom layers later, usually beats building from scratch.
Cost and ROI Model for Indian SMBs and Startups
Manual reporting consumes 40 to 60 finance hours monthly, at ₹2,000 per hour, plus CA review, easily crossing ₹70,000 per quarter, not counting decision delays. Automated platforms run ₹10,000 to ₹30,000 monthly, covering dashboards, board packs, and support.
- ROI: Save 50 hours monthly, reduce errors, speed decisions, and improve investor relations, with breakeven in one to two months.
- Pricing fit: Transaction based tiers scale with growth, avoiding flat fees that punish small companies and percentage fees that penalize success.
Implementation Plan: Your First 90 Days
Days 0 to 30, foundation
Connect accounting and banks, link GSTN, define 10 to 15 KPIs, train your team on navigation and data checks.
Days 31 to 60, expansion
Ship your first investor update, refine board templates with branding, add function dashboards, set alerts, document SOPs.
Days 61 to 90, full cycle
Run a complete quarter end, collect board feedback, tune dashboards and templates, automate adjacent workflows, and celebrate faster closes.
Pitfalls: Do not automate everything at once, fix source data quality first, and train all users thoroughly.
Success Story: Mumbai SaaS Startup Transforms Board Reporting
Before automation, a Mumbai SaaS team lost four days monthly to Excel chaos and GST mismatches, and the board debated conflicting numbers. After rollout, their executive dashboard went live in two days, monthly close dropped to two hours, and board questions fell 70 percent. The CA validated reports for audits, real time dashboards ended version sprawl, and compliance stayed on track. Savings crossed ₹50,000 monthly, growth accelerated, and Series A closed smoothly.
How Virtual Accounting Supports Board Reporting Automation in India
Virtual Accounting by AI Accountant delivers India ready board reporting automation, with real time executive dashboards, automated MIS packs, and quarterly board reports. Pre built board decks and investor update templates remove formatting work.
Local compliance is first class, GST reconciliation, TDS tracking, and ROC monitoring, all validated by a dedicated CA team. Connect books and banks in minutes, set KPIs, generate board packs, and collaborate in one platform.
Transparent pricing starts at ₹4,000 monthly for up to 200 transactions, with higher tiers for unlimited volumes, and your executive dashboard goes live within 24 hours.
Resources and Templates to Get Started
- Google Slides and PowerPoint board deck templates, structured with placeholders, ready to customize.
- Notion and email investor update templates, monthly and quarterly versions, with example narratives.
- Executive dashboard KPI checklist, with industry examples and calculation formulas.
- Vendor evaluation worksheet and total cost of ownership calculator, with weighted scoring.
- Implementation and integration guides, troubleshooting notes, and change management tips.
Start Your Board Reporting Automation Journey Today
Automation turns quarterly panic into calm preparation, investors see clarity, and you reclaim your weekends. India’s GST, ROC, and investor expectations demand a better process, and manual workflows do not scale.
Explore the complete solution on the Virtual Accounting page, and transform your next board cycle from grind to glide. Visit Virtual Accounting to see how fast you can go live.
FAQ
What exactly does board reporting automation give me that spreadsheets do not?
It creates a single source of truth by pulling data directly from accounting, banks, CRM, and GST portals, computes KPIs consistently, generates board packs and investor updates on demand, and keeps compliance front and center, so you stop reconciling conflicting files and start discussing decisions.
Can this connect reliably to Tally, Zoho Books, and QuickBooks without constant fixes?
Yes, mature platforms offer native connectors and scheduled syncs for Tally, Zoho Books, and QuickBooks, plus CSV backups. A good setup also maps your chart of accounts once, then reuses that mapping every cycle, so finance does not babysit integrations.
How do I show cash runway and burn rate clearly to the board?
Make cash balance, monthly burn, and months of runway the hero metrics on your executive dashboard, with green, amber, red cues. Automation updates them daily from bank and ledger data, and highlights deltas when burn changes because of hiring, marketing, or seasonality.
Will the system handle GST, TDS, and ROC, or do I still need manual trackers?
Good tools include GST payable versus ITC, TDS deducted versus deposited, and ROC calendars with due dates and alerts. This eliminates ad hoc trackers, and lets your CA validate everything in one view before filings.
How fast can we go live, and who needs to be involved?
Most teams go live in one to two weeks for dashboards and investor updates, and within one quarter for a full board cycle. Involve your finance lead, founder for narrative, and CA for compliance sign off. Keep scope tight at first, then expand.
Do we need a data team, or can finance operate this day to day?
Finance can run it. Platforms hide the plumbing, schedule syncs, and log changes. You may loop in a data analyst for custom metrics, but for standard board reporting, finance and your CA are enough.
Can we manage multiple entities and consolidated reporting?
Yes, multi entity views let you switch between individual books and consolidated statements, with intercompany eliminations and currency conversion where needed, so you can brief the board on both entity health and group performance.
How do investor updates plug into the same workflow?
Use the same data source and definitions that power your board dashboard, then export a shorter investor update template with 8 to 10 KPIs, product or GTM notes, hiring, cash and runway, and clear asks. Consistent definitions are the secret to credibility.
Is automated data acceptable for board packs and audits?
Yes, when sourced correctly. See guidance on board packs and statutory audits. Bank feeds and GSTN APIs provide source verification, audit trails record every change, and CAs increasingly endorse automated systems as the source of truth.
What does this cost, and how do I model ROI for my stage?
Expect ₹10,000 to ₹30,000 monthly for a comprehensive stack. If you save 40 to 60 hours per month and reduce errors, payback often lands within one to two months. Add soft benefits like faster fundraising and better decisions to see the full picture.
Should we build, buy, or try a hybrid?
Build when your KPIs are unique and you have time and engineers. Buy when you need speed and predictability. Many teams buy for finance reporting, then layer custom analysis in Sheets or a data notebook for niche needs, which balances speed and flexibility.
What does a 90 day rollout look like, and what pitfalls should we avoid?
Thirty days for connections and core KPIs, thirty for templates and alerts, thirty for a full quarter cycle. Avoid automating everything at once, fix source data quality early, and train users properly. A service like Virtual Accounting by AI Accountant can guide the rollout and validate compliance as you ramp.
Can a virtual accounting partner run the whole motion for us?
Yes, with an India first service that understands GST, TDS, and ROC, you can outsource setup, monthly closes, investor updates, and quarterly board packs. This is ideal for lean finance teams or fast growing startups that need speed without adding headcount.

A results-driven finance and sales professional with hands-on experience through finance internships and a fast-paced sales role. With a strong interest in accounting and business finance, Harsh focuses on turning complex topics into clear, practical takeaways for founders and finance teams.