-01%201.svg)
Key takeaways
- A board-ready finance deck is a decision tool, not a data dump, every slide should push the discussion toward actions and approvals.
- Lead with an executive summary that frames the story in 60 seconds, three to five north-star metrics, wins, challenges, and clear asks.
- Show budget versus actuals, runway, and working capital drivers with simple visuals, trend lines, and variance bridges, keep it concise, consistent, and comparable.
- Cash clarity wins board confidence, bring clean cash flow, scenario runway, and sensitivity analysis, so there are no surprises.
- AR and AP aging, DSO and DPO, and GST reconciliation are essential, profits are meaningless if cash is stuck.
- Be transparent on risks, show mitigation owners, timelines, and early warning indicators, credibility beats perfection.
- Automate data prep so you can spend time on analysis, not Excel, modern tools can refresh dashboards and commentary in minutes.
Table of contents
Executive Summary: Your 60 Second Pitch
Your executive summary is the trailer for the financial story. Board members are busy, some will only read this page, so make it count.
- North-star metrics: revenue for the quarter, cash position, burn or growth rate, and EBITDA.
- Wins and challenges: call out the big client win, the stretched working capital, the delayed collection, briefly and directly.
- The ask: approvals you need, for hiring, a credit line, a capex decision, list them explicitly.
Use bullets, not paragraphs, add one simple visual, for example a revenue trend or runway bar, and frame the narrative so every later slide flows from this page.
Tip: Think “If they only saw this slide, would they understand the quarter, the risks, and what I need from them?”
Clarity beats completeness. One page, one message, one clear set of decisions.
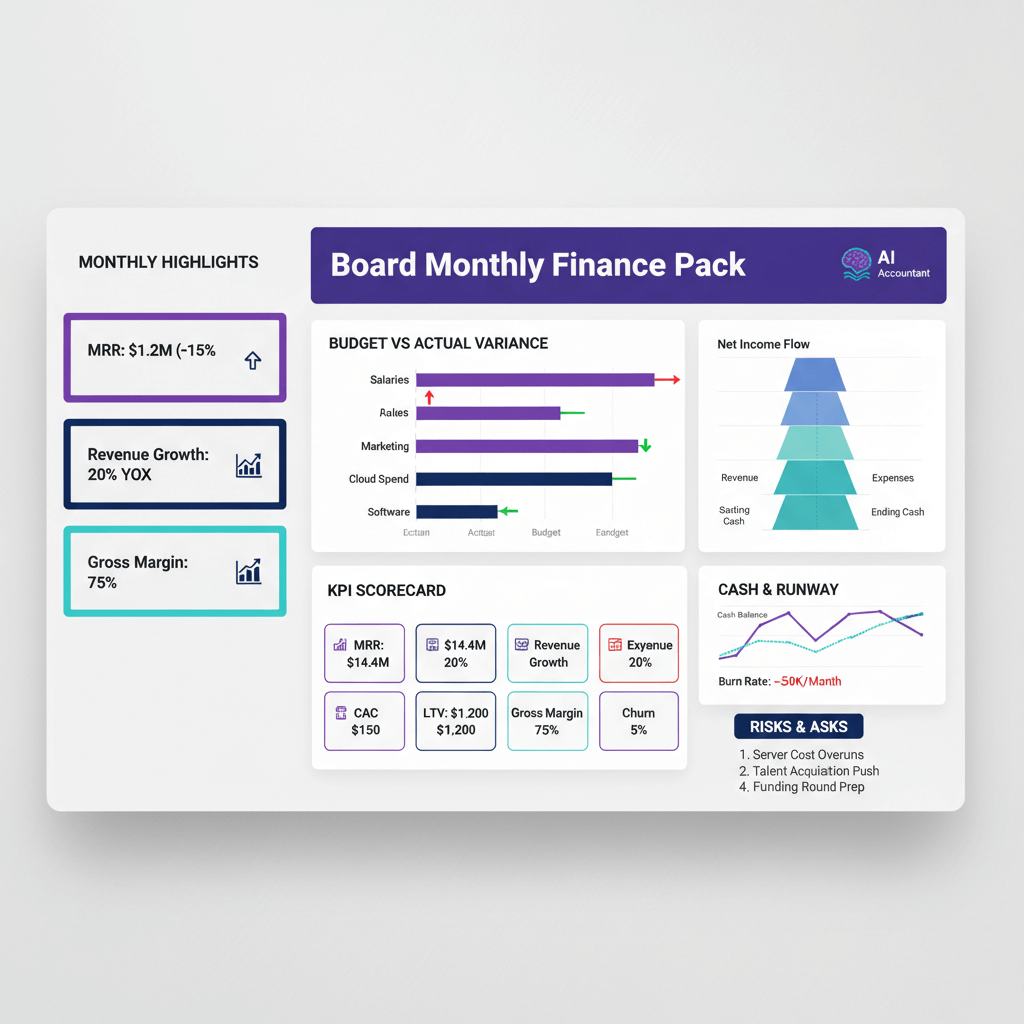
Financial Performance Dashboard
This is where your story begins in numbers, but only the numbers that matter for decisions.
- Start with budget versus actuals, show revenue, expenses, and EBITDA with variance percentages, highlight the big movers.
- Add a simple waterfall to explain major variances, for example delayed collections, one-time GST payments, or hiring ramp.
- Include four-quarter trends for revenue, operating expenses, gross margin, and operating cash flow.
- For Indian companies, include a GST impact line, input credit utilization, pending refunds, and any reconciliation gaps.
Modern tools can automate this view from Zoho Books or Tally data, no spreadsheet gymnastics, just decisions.
Two slides max, one for P&L metrics, one for cash flow, consistent labels and number formatting, lakhs and crores for Indian audiences.
Key Metrics That Drive Decisions
KPIs predict the future, so pick the few that actually steer the business.
- SaaS or subscription: MRR, new and expansion MRR, churn, and net revenue retention, above 100% means growth without net-new logos.
- Unit economics: CAC, LTV, and LTV:CAC, target 3:1 or better, track trend lines, rising CAC with flat LTV is a red flag.
- Working capital: DSO, DPO, and inventory days, the gap defines your cash conversion cycle, crucial in extended payment environments.
- Runway: cash divided by monthly burn, model base, best, and downside scenarios, include the trigger points for actions.
- Operational levers: utilization, inventory turns, capacity usage, the few that link directly to cash and margin.
Always show target, actual, and the gap, then the action to close the gap. A line for trend, a small gauge for target versus actual, keep it visual and readable.
Cash Flow Analysis and Runway Scenarios
Cash is oxygen, the board must see timing, trajectory, and triggers.
- Bring a clean cash flow statement, opening balance, operations, investing, financing, closing balance, with prior quarter actuals and next two quarter projections.
- Break down operating cash into collections, vendor payments, payroll, GST payments, and one-time items.
- Show a cash runway chart for 12 months, base, best, and downside paths, and where each scenario crosses critical thresholds.
- Include a sensitivity table, for example collections slip by 15 days, prepayment for inventory, GST refunds delayed, what happens to months of runway.
- Map working capital drivers, trend DSO, DPO, and inventory days, improving any one of these is like unlocking free cash.
State the “If-Then” triggers, if runway drops under six months, then freeze hiring, if DSO crosses 60, then escalate collections on top ten customers.
Accounts Receivable and Payable Insights
Strong profits, weak cash, the AR and AP story explains the gap.
- AR aging: current, 30, 60, 90, over 90 days, both value and percent of total, over 20% beyond 60 days means a collection problem.
- Top 10 customers: outstanding amount and days, call out concentration risk and specific follow-ups.
- Receivables trend: AR and DSO versus revenue growth, if AR grows faster than revenue, fix terms and follow-ups.
- AP aging: older is not always bad, but watch critical vendors and terms, avoid penalty interest and supply risk.
- Top 10 vendors: amounts, terms, discounts for early payment, and operational criticality.
- GST reconciliation: input credit available versus claimed, mismatches with GSTR 2B, and remediation plan.
Automation can match invoices to payments, flag anomalies, and track promises to pay, saving hours and improving accuracy.
Critical Risks and Mitigation Plans
Show you see the risks clearly, and you own the mitigations.
- Financial: customer concentration, currency exposure, working capital squeeze during growth.
- Operational: key person dependencies, system downtime, vendor concentration, compliance gaps.
- Market and regulatory: competitive pressures, policy shifts, GST and TDS changes.
For each risk, state the probability, impact, owner, mitigation steps, and timelines. Add early warning indicators, for example top customer share of revenue by month, DSO weekly movement, or refund aging.
Be explicit, not vague, “Renegotiating credit line to 12 crores by 31 Mar” is stronger than “Exploring options”.
Decision Points and Board Approvals
Your board is here to decide, make approvals easy and well framed.
- Context first: the why, the amount, proposed terms, and the alternatives considered.
- Decision framework: business case, financial impact, risk if we do nothing, implementation timeline, and owner.
- Hiring: show ROI, for example a sales head at 15 lakhs that unlocks 1 crore revenue, a finance analyst at 8 lakhs that saves 20 days of manual work monthly.
- Capex: payback period, IRR, and milestones, for example 50 lakhs automation with 18 month payback.
- Sensitivity: what if outcomes land at 70% or timelines double, quantify the downside.
Close prior actions, what was approved last time, status, and what changed, then list today’s approvals with a simple yes or no structure.
Best Practices for Deck Design and Presentation
- One message per slide, clarity over aesthetics, and consistent fonts and number formats.
- Use visuals that match the message, waterfall for variances, line for trends, bars for comparisons, tables for detail.
- Format numbers for India, lakhs and crores, round to meaningful digits, 43% not 43.27%.
- Add slide numbers and section headers, and keep the main deck within 15 to 20 slides, park detail in an appendix.
- Design for screen sharing, larger text, fewer elements, more white space, and test on a laptop.
- Share 48 to 72 hours in advance, and include a change log if you update later.
Practice delivery, anticipate questions, and keep backup slides ready, confidence in the room signals control of the numbers.
Common Pitfalls to Avoid
- Surprising the board with bad news, call it early and frame the plan.
- Jargon without definitions, define CAC, DSO, EBITDA on first use or include a glossary.
- Overlong decks, filter ruthlessly for decisions and actions.
- Manipulating timing or recognition, credibility once lost is hard to regain.
- Ignoring prior feedback, if the board asked for cohorts, include them next time.
- Blaming externals only, pair context with the response plan you control.
- Copy paste risks from spreadsheets, broken formulas and inconsistent formats erode trust, automate where possible.
Numbers tell what happened, stories explain why, and actions show leadership.
Technology and Automation for Board Reporting
Manual prep is a quarterly grind, automation changes the game.
- Automate data collection, tools like AI Accountant sync with Zoho Books and Tally so actuals refresh automatically.
- Use AI for categorization, it learns from your patterns and reduces coding errors.
- Implement real-time dashboards for cash and KPIs, spot trends early instead of reacting late.
- Automate reconciliation, bank, GST, and vendor reconciliations move from days to hours, with audit trails.
- Adopt template-based reporting, build your board deck template once, then refresh data quarterly.
- Set alerts on thresholds, for example DSO above 45 days or runway below two months, escalate automatically.
- Use version control in collaborative tools, no more “Final Final V3”.
- Leverage automated commentary for standard variances, refine the draft, save time for analysis.
Automation does the mundane, you do the judgment, the quality of discussion improves when the data prep disappears.
Conclusion: Your Board Deck as a Strategic Tool
A great board deck tells a clear story, where you have been, where you are, where you are going, and what you need. Focus on decision usefulness, build trust through transparency, and make every insight actionable.
Use technology to reclaim time for strategy. Tools like AI Accountant help automate data prep, so you can focus on analysis and narrative.
Start early, iterate monthly, and refine before the meeting. There is no perfect deck, but there is a great one, the one that drives decisions, builds confidence, and showcases you as a strategic finance leader.
FAQ
How should a CA structure the executive summary for board readiness in under one minute?
Lead with three to five north-star metrics, then one line each on wins and challenges, and end with explicit asks. Use bullets, not prose, for example “Revenue 22 crores, Cash 9.5 crores, Runway 8 months, Win: enterprise deal signed, Challenge: DSO slipped to 58 days, Ask: approve 12 crore working capital line”.
What is the minimum KPI set a board expects for a SaaS business in India?
MRR with new and expansion breakdown, churn, Net Revenue Retention, CAC, LTV, LTV:CAC ratio, DSO and DPO, and cash runway with scenarios. For fast-growing SaaS, add cohort retention and payback period on CAC. An AI tool like AI Accountant can auto-refresh these from your ledger and billing systems.
How do I present budget versus actuals with variance without overwhelming the board?
Show a single table with revenue, COGS, Opex, EBITDA, and operating cash flow, include absolute and percent variance, then a waterfall for the top five drivers. Keep the rest in the appendix. If you maintain a template in an automated system, the layout stays consistent quarter to quarter.
What sensitivity analysis should I show for runway if collections often delay by 15 to 30 days?
Model at least three cases, base, minus 15 day collection delay, and minus 30 day collection delay, and quantify impact on months of runway and covenant headroom. Tie each case to actions, for example freeze hiring, slow capex, or accelerate AR follow-ups on the top ten customers.
How do I benchmark DSO and DPO for Indian B2B companies when terms are fluid?
Use your last four quarters as the baseline trend, target DSO improvement in five day steps, and lock DPO targets based on vendor tier, critical vendors may need tighter cycles, non-critical vendors can be stretched with care. Show concentration by customer and vendor so the board understands the real levers.
What is the cleanest way to show GST impact in the board deck?
Add a GST line on the cash view, highlight input credit utilization, pending refunds, and any GSTR 2B mismatches. Summarize monthly movement and include a reconciliation status, for example “2B mismatch 1.8 lakhs, rectification in progress, expected closure next month”. AI Accountant style tools can auto-reconcile and flag mismatches.
How can I defend a hiring or capex ask with numbers the board will trust?
Show ROI, payback, and sensitivity. For hiring, present cost, productivity ramp, and pipeline coverage, for capex, present payback months, IRR, and milestones. Always include the downside case at 70% performance, and show the mitigation if the downside materializes.
What goes into a risk heat map that actually drives action, not just color?
For each risk, list probability, impact, owner, next action, timeline, and early warning indicator. Example, “Customer concentration, high impact, medium probability, Owner: CRO, Action: top-five diversification plan by Q2, EWI: top customer share under 25%”. Update progress every quarter.
How do I keep AR collections tight without damaging key relationships?
Segment customers by risk and value, offer early payment incentives on healthy accounts, escalate contact cadence on overdue accounts, and involve senior leadership for top exposures. Show the board a payment priority matrix and the weekly promise-to-pay tracker. AI Accountant like systems can automate reminders and track follow-ups.
What is the ideal slide count and structure for a main deck versus appendix?
Keep the main deck to 15 to 20 slides, executive summary, dashboard, KPIs, cash and runway, AR and AP, risks, decisions, best practices or key changes, and conclusion. Put statement-level detail, cohort tables, and model assumptions in the appendix, and send both 48 to 72 hours before the meeting.
How can an AI tool help me avoid last-minute spreadsheet errors before the board meet?
Use a system that pulls actuals from source, enforces mappings, and validates integrity, for example AR plus AP ties to the balance sheet, revenue by segment ties to the P&L, and cash balances match bank feeds. AI Accountant style platforms add anomaly detection and draft variance commentary, reducing last-minute fire drills.
If the board asks for a downside plan, what exact items should I include?
Include trigger thresholds, actions, and financial impact. For example, “If revenue down 20%, then pause hiring, reduce discretionary spend by 30%, extend DPO by seven days, and draw on the credit line”, show the runway impact and timing. Pair this with a monthly monitoring dashboard so the plan is operational, not theoretical.

Rohan Sinha is a fintech and growth leader building aiaccountant.com, focused on simplifying accounting and compliance for Indian businesses through automation. An IIT BHU alumnus, he brings hands-on experience across 0 to 1 product building, growth, and strategy in B2B SaaS and fintech.