-01%201.svg)
Key takeaways
- A working capital dashboard for India gives SMEs and CA firms real time visibility across cash, receivables, payables, and inventory, factoring in GST, MSME payment rules, and UPI or NEFT banking realities so you catch liquidity problems before they become crises.
- Track DSO, DPO, inventory turns, cash conversion cycle, and aging buckets daily, then set alerts that trigger action when thresholds are breached, not just passive monitoring.
- Clean masters and disciplined weekly reconciliations are the foundation. Without data hygiene, your dashboard metrics will mislead more than guide, especially when a single mismatched GSTIN can block lakhs in ITC.
- Seasonality matters in India. Set thresholds that flex during Diwali, monsoon, and harvest months, and use weekly exception alerts layered on monthly trend baselines to stay responsive without overreacting.
- Platforms like AI Accountant's MIS reporting automate the heavy lifting of reconciliation, aging analysis, and multi org views, turning scattered Tally data into a reliable working capital dashboard that drives decisions, not just displays numbers.
Working Capital Dashboard India: What's New in 2026
The biggest shift hitting working capital dashboards in 2026 is the expanded GST e-invoicing mandate. Until March 2025, e-invoicing applied to businesses with turnover above ₹5 crore. From April 2025, this threshold dropped to cover a much larger base of SMEs, as notified via CBIC circulars. That means your dashboard now needs to ingest and reconcile e-invoice data for entities that previously handled invoicing manually or semi-manually.
The operational impact is real. Invoice Reference Numbers (IRNs) must now be validated before booking payables or receivables. Mismatches between e-invoice data and GSTR 2B block ITC faster than before. If your dashboard pulls from Tally but does not cross check IRN status, you risk showing receivable or payable figures that are technically disputed or non-claimable.
This hits trading and manufacturing SMEs with turnover between ₹1 crore and ₹10 crore hardest. Many of these businesses were running on manual bill entry until recently. CA firms managing 15 to 30 such clients now need multi org dashboards that flag IRN mismatches, GSTR 1 versus 2B gaps, and MSME payment breaches across all entities in one view. Ignoring these reconciliation gaps can mean ITC reversals, interest at 18% under GST portal rules, and delayed refunds that directly worsen your cash conversion cycle.
What to do now:
- Audit your current dashboard data sources. Confirm e-invoice and IRN data flows into your reconciliation layer, not just invoice amounts.
- Set up GSTR 2B mismatch alerts at the entity level, not just in aggregate. Flag supplier side filing gaps within 48 hours of the filing deadline.
- For CA firms, ensure your multi org view segments MSME vendor payables separately with day 40 alerts, since penalty exposure compounds across clients.
Teams already using automated GST reconciliation workflows are catching these mismatches within hours instead of discovering them at quarter end.
Table of contents
What a Working Capital Dashboard Is in the India Context
Picture a growing SME in Mumbai. Sales are strong, yet vendor payments are slipping because a major client is at 60 days overdue. A working capital dashboard in India turns that chaos into clarity. It aggregates signals from cash balances, receivables, payables, and inventory, while addressing GST reconciliation, mismatched GSTINs in Tally or Zoho, and bank feeds across UPI and NEFT.
Think of it as your financial control room. Instead of juggling multiple Excel sheets and Tally reports, you see exactly where cash is stuck. You know which customers are delaying payments and which vendors need immediate attention.
Outcomes include quicker month ends, fewer liquidity surprises, and proactive management of receivable and payable days, inventory turns, cash conversion cycle (CCC), aging buckets, plus smart alerts that keep you ahead of problems.
For broader fundamentals, the Reserve Bank of India publishes periodic guidance on working capital financing norms that shape how lenders evaluate your liquidity position.
For CA firms, cross client patterns reveal bottlenecks early, enabling advisory that is proactive, not reactive.
Core Metrics to Track
Receivable and Payable Days
DSO (Days Sales Outstanding) measures average collection time. A quick example: receivables of ₹50 lakhs with monthly credit sales of ₹40 lakhs gives DSO of 37.5 days. You are waiting over a month to get paid after making a sale.
DPO (Days Payable Outstanding) tracks how long you take to pay vendors. Use rolling averages. Adjust for credit notes, advances, and partial payments, otherwise results get distorted. Exclude advances from DSO to avoid artificially inflated numbers.
If DSO is 45 days and DPO is 30 days, you are financing customers with your own cash or costly working capital loans.
Inventory Turns
Inventory turnover equals cost of goods sold divided by average inventory. Trading businesses often target 8 to 12 turns annually. Manufacturing sees 4 to 8. D2C brands achieve 6 to 10.
Link turnover to dead stock detection and procurement cycles. Adjust baselines for seasonality. A garment trader will see different rates during festivals versus monsoon. Watch items stuck beyond 120 days. Your dashboard should flag these for clearance or supplier negotiations.
Cash Conversion Cycle (CCC)
CCC equals DSO plus DIO (days inventory outstanding), minus DPO. It tells you how long cash is tied up in operations. Shorter cycles free cash.
A textile trader in Surat moved CCC from 75 days to 50 by extending DPO to 45 days and tightening DSO to 35 days. This freed ₹25 lakhs without new funding. Remedies include tighter aging follow ups and inventory optimized to real demand patterns.
Vendor and Customer Aging
Use India standard buckets: 0 to 7, 15, 30, 60, 90, 120 plus. Prioritize high value overdues first.
Pay special attention to MSME vendors because of the 45 day payment rule under the MSMED Act provisions. Generate action lists. Tell collections who to call today. Tell payables who to schedule this week based on terms, cash, and importance.
Visual Layout and UX
Your dashboard should be scannable within seconds. Here is what to include:
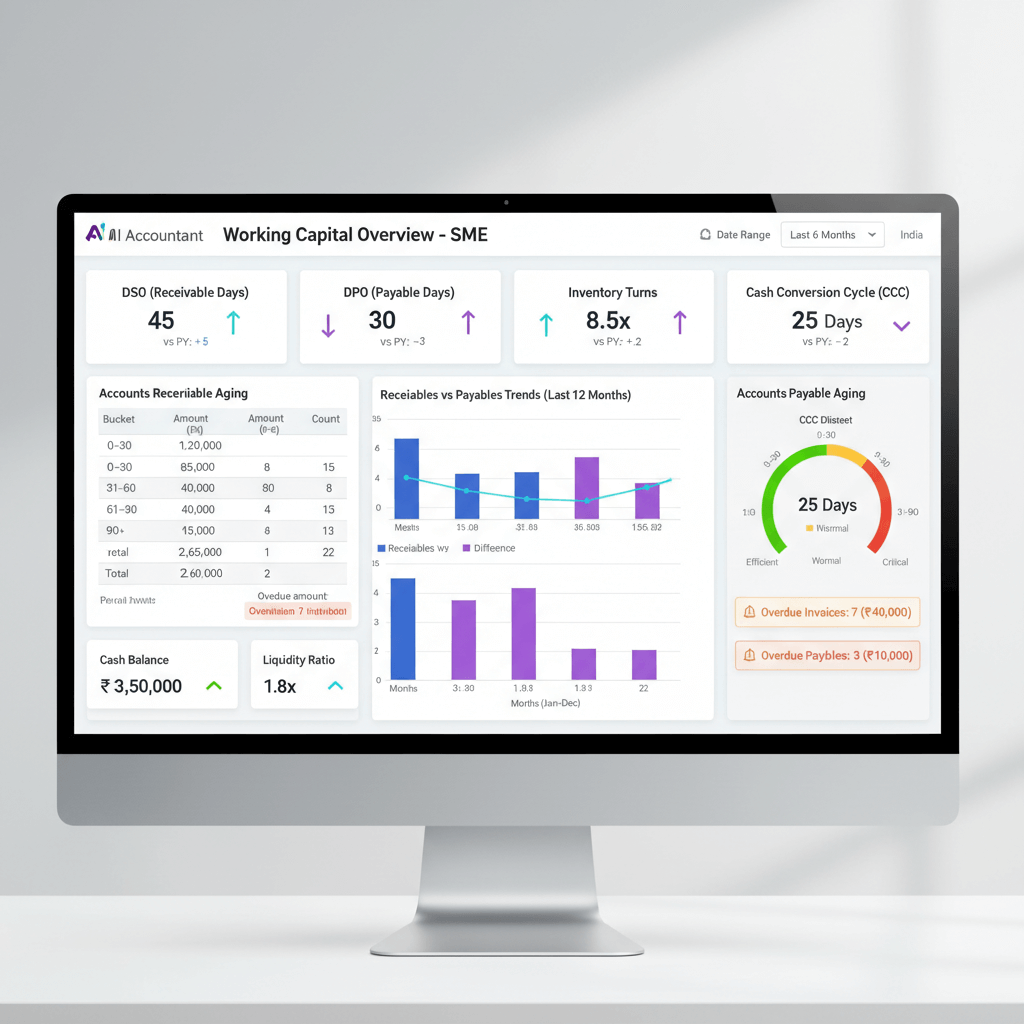
- Overview tiles for cash on hand, DSO, DPO, inventory turns, CCC, and total overdues
- Trend lines across the last 12 months for DSO, DPO, and CCC to reveal seasonality and progress
- Aging matrices with drill downs (click "₹45 lakhs overdue, greater than 60 days" to see customers and invoice history)
- Inventory views by SKU or category, with slow mover lists for items not sold in 90 days
- Filters for org or branch, region, GST status, and payment mode (UPI, NEFT, cheque)
If understanding takes more than 30 seconds, it is too complex. Simplify.
Data Sources, Integration, and Hygiene
Pull data from Tally or Zoho Books, bank and card statements for true cash, and the GST portal for GSTR 2B to unlock ITC.
Clean masters first. Validate GSTINs, keep consistent SKU codes, and categorize transactions (also called ledger entries) properly. Watch for duplicate vendor entries, untagged receipts not matched to invoices, and off ledger cash activity.
Set weekly reconciliation routines. Every Monday, match bank statements to books. Check vendor invoices (bills) tagged to vendors. Verify receipts applied to invoices, not sitting as advances. One mismatched GSTIN can block lakhs in ITC, hitting cash immediately.
The ICAI has published guidance notes on reconciliation best practices that CA firms can adapt for dashboard workflows.
Alerts and Thresholds for Action
Static dashboards look backward. You need alerts that trigger action.
- Set DSO alerts at 45 days. Escalate at 60.
- Flag your top 20 customers crossing 60 days overdue.
- Alert when DPO drops below terms or exceeds 45 days for MSME vendors.
- Catch trend deviations. If CCC worsens by 10 percent month over month, investigate.
- When inventory turns fall below target for two months, review purchasing.
Event based alerts matter too. Notify at 30, 60, 90 day invoice ages. Flag large payments received. Alert when cash drops below safety levels.
Baselines should use 12 month history, adjusting for seasonality. Diwali may extend CCC by 15 days. January should not.
Operational Workflows
Turn insights into action:
Collections: each morning the team sees a prioritized list by aging, amount, and importance. They log promised dates. The dashboard tracks effectiveness by team member and segment.
Payables: schedule payments by terms, cash position, and strategy. Capture early discounts when possible. Respect the MSME 45 day rule to avoid penalties. Show upcoming obligations at 7, 15, and 30 days.
Inventory: run monthly slow mover reviews. Items older than 120 days get flagged for clearance or return negotiations. Adjust reorder points to actual turnover.
Cash planning: build weekly cash ladders using CCC, DSO, and DPO trends. Know cash needs for next week, month, and quarter. Avoid expensive last minute borrowing.
Every workflow needs owners, documented steps, and measurable outcomes. Track whether actions actually move metrics.
India-Specific Nuances
GST and ITC: reconcile GSTR 2B monthly. Mismatches with supplier GSTR 1 can lock lakhs. Your dashboard should flag these instantly. The GST portal now surfaces supplier filing status more granularly, making real time reconciliation more feasible.
MSME obligations: the 45 day payment rule is not optional. Track MSME vendor invoices separately. Alert at day 40. Non-compliance can attract compound interest at three times the RBI bank rate.
Banking realities: UPI is instant, NEFT may take hours, cheques need 2 to 3 days. Focus on cleared balances. Include overdraft costs in working capital views.
Seasonality: adjust thresholds during Diwali, Dussehra, and regional festivals. Agriculture cycles differ between monsoon and harvest. Set baselines that adapt to your specific business rhythm.
Implementation Roadmap
Step 1, Define your KPIs (Week 1): receivable days, payable days, inventory turns, CCC. Agree on formulas and aging buckets. Document definitions for consistency.
Step 2, Integration setup (Weeks 2 to 3): connect Tally or Zoho Books. Import bank feeds. Configure GST portal access for GSTR 2B. Clean masters diligently.
Step 3, Baseline establishment (Week 4): analyze 12 months to set realistic thresholds. Understand seasonality. Start conservative, tighten later.
Step 4, Build and test views (Weeks 5 to 6): design layouts for different users. Test with live data. Gather feedback from the people using it daily.
Step 5, Ownership and SOPs (Week 7): assign metric owners. Define actions on alerts. Write standard operating procedures. Train teams on tool and process.
Step 6, Iterate and automate (Ongoing): review monthly. Automate exception handling. Add metrics carefully. Focus on what drives action.
Common Mistakes to Avoid
- Ignoring credit notes in DSO and DPO distorts reality. Track them separately and adjust bases.
- Lumping advances with receivables makes DSO look worse. Advances are already collected cash.
- Treating all stakeholders uniformly misses commercial realities. Reflect different terms for large customers and MSME vendors.
- Using static thresholds year round ignores seasonality. What is normal in October may be alarming in April.
- Distorting inventory metrics by mixing returns, work in progress, or consignment with finished goods. Segment cleanly.
- Focusing on metrics without action. Every metric should have a clear "so what" and "now what."
Example Benchmarks
Service Businesses
Focus: DSO and CCC with minimal inventory.
Targets: DSO under 30 days, CCC under 45 days. If a consulting firm sits above 45 days DSO, it is effectively financing clients.
Trading and D2C Businesses
Focus: inventory turns, DPO, MSME compliance.
Targets: turns of 8 to 12 annually, DPO 45 to 60 days. Balance velocity with stock depth to fulfill orders.
Manufacturing Companies
Focus: work in progress and finished goods turns, vendor risk.
Targets: turns of 4 to 8 annually, CCC under 90 days. Reduce work in progress and align production to confirmed demand.
Benchmarks vary by industry and strategy. Premium brands may accept longer DSO for margin. Volume players need speed.
How Tools Help Build Your Dashboard
- AI Accountant: integrates with Zoho Books and Tally, reconciles GST data, configurable alerts for CCC and aging, multi org support for CA firms, accurate bank statement processing for DSO, prevents ITC lock ups through intelligent GST reconciliation.
- QuickBooks: solid dashboards and reporting. Indian GST reconciliation needs customization.
- Xero: strong cash forecasting. Indian GST requires third party apps.
- Zoho Analytics: powerful visualization, pairs well with Zoho Books. Custom dashboards need technical expertise.
- Power BI: flexible for large datasets. Indian specific needs take setup time and resources.
- FreshBooks: good for services with simple needs. Limited inventory features.
The key is choosing tools that understand Indian realities. GST reconciliation, MSME compliance tracking, and multi currency handling are essential, not optional.
Conclusion
Your working capital dashboard for India should track receivable and payable days, inventory turns, CCC, aging buckets, plus smart alerts and thresholds. Visibility is valuable, yet the real benefit is the conversations it drives and the actions it triggers. When DSO creeps up by 5 days, collections can act before it becomes a crisis.
For CA firms, dashboards become a competitive advantage. They enable proactive insights and prevent cash crunches. Start simple. Pick three metrics that matter, set tracking and alerts, then iterate. The goal is not perfection. It is a dashboard that guides better decisions every day. Audit your setup today. Your future self will thank you.
FAQs
Are receivable days and DSO the same, and how should a CA report it to clients?
Yes, DSO is the formal term for receivable days; both measure collection time after a sale. A CA should standardize the formula across clients, use rolling monthly averages, exclude advances, and show trend lines with narrative on actions taken.
How should a CA compute CCC for a pure services client with no inventory?
CCC for services equals DSO minus DPO, since days inventory outstanding is effectively zero. For example, if DSO is 28 and DPO is 15, CCC is 13 days, meaning cash is tied up for nearly two weeks. Use the dashboard to shorten DSO through systematic follow ups and payment method optimization.
What is the recommended aging bucket structure for Indian clients with MSME specifics?
Use 0 to 7, 15, 30, 60, 90, 120 plus day buckets. For MSME vendors, track separately with alerts at day 40 to respect the 45 day payment rule under the MSMED Act. Non-compliance attracts compound interest at three times the RBI bank rate (2026 update).
How does the 2025 e-invoicing threshold change affect working capital dashboards?
From April 2025, the e-invoicing threshold dropped significantly, bringing many more SMEs under mandatory IRN generation. Your dashboard must now validate IRN status before booking receivables or payables, because mismatches between e-invoice data and GSTR 2B block ITC claims faster. CA firms managing multiple clients should ensure IRN reconciliation is built into their multi org dashboard view (2026 update).
What weekly and monthly cadence should a CA recommend for threshold reviews?
Use weekly alerts to catch exceptions and run monthly reviews to confirm trends. Recalibrate thresholds quarterly. This balances responsiveness with stability and prevents teams from chasing noise.
How can an AI driven tool help with GST reconciliation and working capital?
An AI solution like AI Accountant automates GSTR 2B matches, flags supplier GSTR 1 mismatches, prevents ITC lock ups, and surfaces overdue risks by customer, vendor, and invoice. This reduces manual effort and unlocks cash faster.
How should a CA set CCC thresholds for seasonal businesses in India?
Create season based baselines, for example Diwali quarter versus monsoon quarter. Compare year over year by season, not sequential months. Use dashboard alerts that flex within acceptable seasonal ranges so normal festival slowdowns do not trigger false alarms.

Rohan Sinha is a fintech and growth leader building aiaccountant.com, focused on simplifying accounting and compliance for Indian businesses through automation. An IIT BHU alumnus, he brings hands-on experience across 0 to 1 product building, growth, and strategy in B2B SaaS and fintech.