Key takeaways
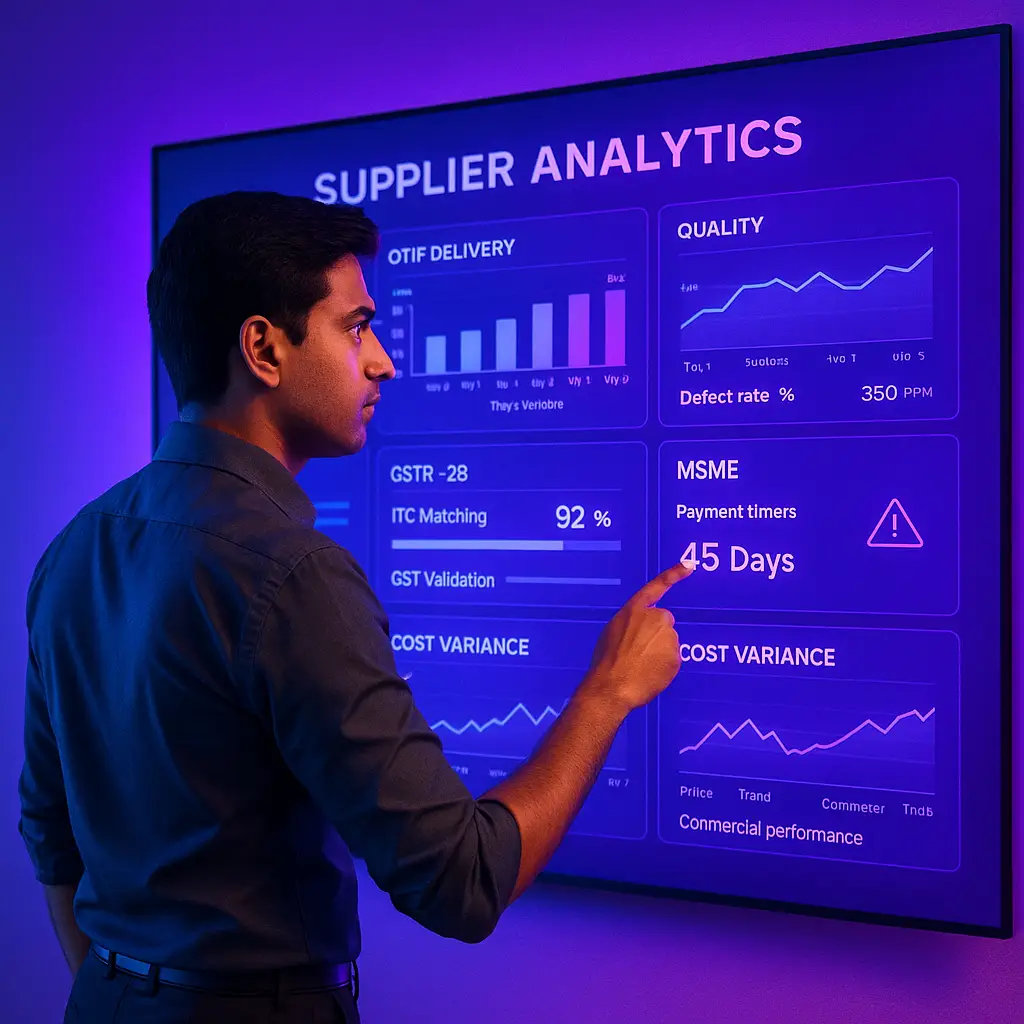
- A supplier performance dashboard India gives SMBs a unified, real time view of delivery, quality, commercial, and compliance metrics, replacing scattered spreadsheets with a single source of truth that drives faster sourcing decisions.
- Indian specific KPIs matter from day one: GSTR 2B match percentage, IRN validation, and MSME 45 day payment tracking are non negotiable for protecting ITC and avoiding penalties.
- Automated vendor ratings convert raw data into objective scores, lifting OTIF by 15 to 25 percent in year one and cutting quality related costs by 30 to 40 percent.
- Start small with your top 20 suppliers and essential metrics, then expand coverage and sophistication as processes mature, most SMBs see payback within three to six months.
- Finance led stacks deploying on Tally can go live in days, not months, especially when vendor bill matching is automated alongside GST reconciliation and MSME compliance tracking.
- Use scorecards to build partnerships, not just police performance: recognize top performers, co create corrective actions with underperformers, and share anonymized benchmarks to motivate improvement.
Supplier Performance Tracking in India: What's New in 2026
Until March 2025, the GST e invoicing threshold stood at ₹5 crore. From April 2025, CBIC lowered it to ₹1 crore, pulling a significant share of additional SMEs into the e invoicing net. For supplier dashboards, this means every vendor scorecard now needs IRN validation as a default compliance check, not an optional add on.
The practical shift is real. Businesses that previously tracked only a handful of e invoice enabled suppliers now need to validate IRN presence across nearly their entire vendor base. Missing IRNs block ITC claims, and GSTR 2B auto population depends on suppliers filing correctly. If your dashboard does not flag missing or mismatched IRNs in near real time, you risk silent ITC leakage that compounds month over month.
Who does this hit hardest? SMBs with 50 to 200 active vendors, especially those in manufacturing and distribution where a mix of large and small suppliers means inconsistent e invoice compliance. Firms still relying on manual checks face the highest exposure. The cost of inaction is concrete: blocked ITC worth lakhs per quarter, 18 percent annual interest on delayed payments under MSME rules, and potential best judgment assessments during GST audits.
What to do now:
- Audit your vendor master for GSTIN accuracy and MSME flags before the next filing cycle.
- Ensure your dashboard validates IRN presence on every inward invoice, not just invoices above ₹5 crore.
- Review your GSTR 2B reconciliation workflow to catch mismatches within the same return period, not after the fact.
Platforms that handle automated GST reconciliation alongside vendor scoring can absorb this expanded compliance surface without adding manual steps. For the latest e invoicing rules, refer to the CBIC official portal and GST portal notifications.
What is a Supplier Performance Dashboard India
A supplier performance dashboard for Indian SMBs is more than a report generator. It is a comprehensive system that turns procurement and finance data into actionable vendor insights. Think of it as your vendor management control tower.
The dashboard pulls from multiple sources: your vendor master database with GSTIN and MSME flags, purchase orders, advance shipment notifications, goods receipt notes, quality logs, invoices, and payment records.
The magic happens when this information comes together. You see KPIs like on time in full rates, fill rates, defect parts per million, invoice accuracy, GSTR 2B match percentage, and days payment outstanding. These update weekly or monthly.
It is specifically valuable for Indian SMBs because it tracks GST compliance through GSTR 2B matching and IRN checks, monitors MSME payment rule adherence, validates e invoices automatically, and accounts for regional delivery constraints that affect your supply chain.
The best dashboards integrate with Tally, Indian banking platforms, and mobile quality apps your teams already use.
Bottom line: unify your delivery, quality, commercial, and compliance signals, then turn them into decisions, not just data.
Core Components of Supplier Performance Tracking
Delivery performance forms the foundation
Delivery metrics tell the story of vendor reliability. The cornerstone is OTIF (on time in full delivery rate), calculated as complete and timely deliveries divided by total deliveries, multiplied by 100.
Track fill rate, lead time adherence, and perfect order rate. Map purchase order promise dates against shipment notices and goods receipt timestamps. Capture partials and split shipments, which are common in India.
Visualize with league tables and A, B, C grading. Above 95 percent OTIF earns A grade. Weekly heatmaps reveal chronic issues early.
Quality metrics drive long term success
Defect rate in PPM gives precision. Track quality pass percentage, non compliance report count, return rates, warranty claims, and CAPA closure time. Weight critical components more heavily. Adjust for seasonality.
Pareto charts show common defect types. Vendor trend lines reveal improvement or deterioration over time.
Commercial metrics connect to your bottom line
Monitor price variance, landed cost variance, discount utilization, invoice accuracy (sometimes called vendor invoice accuracy), debit or credit note frequency, and dispute cycle times.
Add GST compliance KPIs like GSTR 2B match percentage and IRN presence, plus invoice posting delays and blocked ITC by vendor. These are essential for protecting your input tax credit under the current GST framework as outlined by the GST Council.
MSME compliance requires special attention. Track days outstanding against the 45 day limit, and potential penalty exposure. The Reserve Bank of India and MSME ministry have both emphasized stricter enforcement of payment timelines.
Compliance metrics unique to India
Indian supplier evaluation metrics go beyond global best practices. Your dashboard should include GSTR 2B reconciliation status at the vendor level, e invoice and e waybill validation, MSME payment breach registers, and TDS compliance where applicable. These are not optional, they directly affect your ITC eligibility and audit readiness.
Delivery Compliance Tracking Systems
Setting up OTIF measurement
Record promised delivery dates from purchase orders. Capture shipment notifications. Log receipt dates and quantities via goods receipt notes (GRNs). Define on time as on or before promise date. Define in full as 100 percent quantity.
Create automated alerts for breaches. Set thresholds by vendor category. For example, 90 percent for strategic and 95 percent for commodity.
Fill rate analysis beyond basic numbers
Analyze by category, season, and order size. Build heatmaps by month and vendor. Track partial delivery patterns.
Measure operational impact. Predictability often beats slightly higher averages.
Lead time performance measurement
Track variability. A consistent 10 day lead time is better for planning than an unpredictable 8 to 12 day range. Segment by rush, standard, bulk, and NPI orders. Then trend the results.
Perfect order rate implementation
Define perfect clearly: correct items, correct quantities, on time, undamaged, accurate documentation, proper packaging. Weight imperfections by business impact.
Track improvement over time. Reward consistent gains.
Quality Metrics for Supplier Evaluation
Defect rate monitoring and analysis
Calculate PPM as defective units divided by total units multiplied by 1,000,000. Set baselines by product family. Track trends. Categorize defects by type and severity to drive the right supplier actions.
Quality control pass rates
Measure first time acceptance without rework or rejection. Implement risk based sampling plans. Track inspection time as a secondary efficiency metric. Standardize procedures to ensure fair comparisons.
Non compliance report management
Use NCRs (non compliance reports) to document issues, responses, and fixes. Track counts, response time, and recurrence to assess maturity. Categorize root causes to guide supplier development.
Return and warranty claim tracking
Measure return rates and warranty claims by vendor and product family. Analyze time to failure to separate manufacturing from design or application issues.
Link costs back to scorecards and commercial discussions.
Building Vendor Rating Automation
Designing your scoring model
A balanced model often allocates 40 percent to delivery, 30 percent to quality, 15 percent to cost, 10 percent to service, and 5 percent to compliance. Adapt by vendor category.
Compliance scoring is crucial in India. Track GSTR matching, e invoice compliance, MSME adherence, and certification maintenance. The ICAI has also published guidance on internal controls that supports structured vendor evaluation frameworks.
Automated data collection and processing
Pull data from ERP (like Tally), quality systems, and payment platforms. Update scores weekly or monthly. Create exception queues for anomalies. Maintain transparent audit trails.
Robotic process automation (RPA) can help extract and normalize data from diverse sources, reducing manual ledger entry errors and reconciliation delays.
Automated scorecard distribution
Generate and email vendor scorecards monthly or quarterly. Include benchmarks, trends, and action items. Tailor formats for vendors, internal users, and executives. Configure alerts for threshold breaches.
Continuous improvement integration
Link scores to sourcing decisions. Track improvements. Recalibrate models when business conditions change. Recognize top performers.
Vendor Scorecard Software Options
Dedicated vendor scorecard platforms
These offer deep functionality: API integrations with Tally, Zoho Books, and SAP Business One, built in GST features, mobile QC, ML analytics, and supplier portals. Expect weeks to months for implementation. Suited to complex, multi site portfolios.
Finance led technology stacks
Many SMBs start with accounting driven approaches that deploy fast.
- AI Accountant provides automated vendor rating from live accounting data, plus GST and payment compliance, with direct Tally integration
- QuickBooks supports vendor reporting and custom views
- Xero offers supplier tracking via projects and reports
- FreshBooks covers payment tracking and analytics
- Zoho Books includes built in vendor management and scorecards
Comparison framework for decision making
Evaluate integration, compliance automation, user experience, scalability, and total cost of ownership. Choose platforms that grow with your vendor count and transaction volume.
Implementation Roadmap for SMBs
Week one: foundation and planning
Define KPIs and weights with cross functional input. Clean the vendor master. Verify GSTIN. Flag MSME status. Standardize names.
Prioritize your top 20 suppliers. Document data sources. Set baseline expectations.
Week two: data integration and testing
Connect Tally (or your ERP), QC databases, and spreadsheets. Backfill 12 months of history. Build prototype dashboards. Validate calculations. Configure alert thresholds.
Week three: pilot testing and refinement
Run a pilot with top suppliers. Adjust thresholds. Finalize scorecard templates. Define exception workflows. Train teams with SOPs.
Week four: launch and governance
Communicate methodology to suppliers. Distribute first scorecards. Agree on corrective actions. Formalize monthly or quarterly reviews. Recognize top performers.
Sample Vendor Scorecard Template
Scorecard structure and grading
Summarize each vendor with current performance, targets, and weighted scores.
Example: Vendor XYZ shows 95 percent OTIF versus 90 percent target, 98 percent fill rate versus 95 percent target, 300 PPM defects versus 250 PPM target, 99 percent invoice accuracy with 100 percent GSTR 2B matching, negative 0.5 percent price variance, and 2 day dispute resolution. Weighted score of 92 equals Grade A.
Performance banding system
- Grade A, 85 to 100: approved and preferred
- Grade B, 70 to 84: approved with monitoring
- Grade C, 55 to 69: probation with formal plans
- Grade D, below 55: business reduction or replacement
Action planning integration
Link grades to actions. Expansion for A. Focused improvements for B. Corrective action plans for C. Immediate risk mitigation for D.
Quarterly business review integration
Use scorecards as the core of QBRs. Add market intelligence, capacity planning, and technology roadmaps. Share anonymized benchmarks to motivate improvement.
ROI and Business Outcomes
Supply chain reliability improvements
Scorecards typically lift OTIF by 15 to 25 percent in year one. This reduces stockouts and expedite spend by 2 to 5 percent of procurement. Quality related costs often fall by 30 to 40 percent. Inventory turns improve with better reliability.
Cost management benefits
Objective data improves supplier selection and negotiation. Invoice accuracy cuts AP overhead. Compliance automation prevents blocked ITC and penalties. Consolidation can deliver 5 to 10 percent savings.
Working capital optimization
MSME tracking prevents penalties and improves cash planning. Predictable supply reduces safety stock. Faster dispute resolution reduces aged payables. Overall resilience increases.
Strategic partnership development
Objective performance fosters collaborative improvement. It strengthens sourcing decisions and supports better contract outcomes with documented history.
Common Pitfalls to Avoid
Metric design and weighting mistakes
Do not overweight cost while underweighting delivery and quality. Adjust for seasonality. Clean your vendor master. Set realistic targets based on benchmarks and history.
Process and automation issues
Manual scorecards do not scale. Automate data collection, scoring, and distribution. Maintain a steady review cadence. Train suppliers on the methodology.
Vendor relationship management errors
Give new vendors a ramp period. Differentiate by strategic importance. Focus on partnership, not punishment. Recognize excellence.
Data quality and system integration problems
Standardize definitions. Invest in API integrations. Keep robust audit trails. Set exception handling for anomalous data.
According to a PwC India analysis, poor master data quality is one of the top reasons vendor automation projects underperform in their first year.
Frequently Asked Questions
How should a CA compute OTIF for partial shipments without double counting GRNs?
Define an order line as on time only when cumulative received quantity reaches the ordered quantity by the promise date. Treat partials as not in full until the threshold is met. Use a one order line, one OTIF verdict rule to avoid double counting multiple GRNs, and have the system collapse multiple receipts against one PO line before scoring.
What is the minimum data set in Tally to start vendor scoring?
You need five things: vendor master with GSTIN and MSME flag, POs with promise dates, GRNs with receipt dates and quantities, invoices with IRN and amounts, and payments with dates and mode. With this, you can compute OTIF, fill rate, invoice accuracy, DPO, GSTR 2B match, and MSME 45 day compliance. You can add QC logs later as a second phase.
How do I reconcile GSTR 2B mismatches to vendor scorecards and ITC blockage risk?
Create a vendor level 2B match percentage and a value at risk metric for unmatched ITC. Categorize mismatches as timing, value, or missing invoice. Reflect the match percentage in compliance scoring, and use alerts for vendors causing blocked ITC repeatedly. With the ₹1 crore e invoicing threshold now in effect, nearly all vendors should appear in your 2B auto population, making persistent mismatches easier to isolate (2026 update).
How should MSME 45 day compliance be monitored and provisioned in books?
Track invoice date, goods acceptance date, and payment date. Use the earlier of invoice or acceptance to compute days outstanding. For invoices beyond 45 days, compute potential interest exposure at 18 percent per annum, provision periodically, and escalate payment prioritization.
How do I calculate perfect order rate in an Indian logistics context with e waybill and IRN?
Define perfect as correct item and quantity, on time, undamaged, correct documentation including e invoice IRN and e waybill, and correct packaging. Score one point per dimension. Perfect order equals all points present. Adjust weights if documentation errors cause ITC risk.
What governance cadence works for supplier reviews and escalations?
Weekly: exception review for red alerts on critical vendors. Monthly: vendor scorecard distribution and internal review for top suppliers. Quarterly: QBR with strategic vendors covering trends, CAPA progress, capacity and roadmap. Annually: re baseline targets and weights.
How do I quantify ROI from a supplier dashboard for management approval?
Build a benefits model: reduce expedites by 2 to 5 percent of procurement, lift OTIF by 15 to 25 percent to cut stockouts, reduce quality costs by 30 to 40 percent, improve inventory turns by 15 to 25 percent, and protect ITC by raising 2B match percentage. Compare benefits to license and implementation costs. Most finance led stacks show a three to six month payback.
Where AI Accountant Fits in Your Vendor Management
Finance data integration and automation
AI Accountant pulls invoices from Tally, cross references POs, and computes price variance, invoice accuracy, and payment timeliness. It runs automated GSTR 2B matching, e invoice validation, and ITC tracking, plus MSME monitoring and alerts for term breaches and unusual invoice patterns.
Dashboard and scorecard generation
Supplier dashboards generate automatically from accounting data. You can add delivery and quality metrics through simple uploads or API connections. Commercial insights sit beside AP or AR summaries for a complete financial view of each vendor.
Monthly or quarterly scorecards are produced consistently and can be shared with suppliers.
Fast deployment for Indian SMBs
Deploy in days or weeks since it builds on your existing systems. Indian specific needs like GST compliance, MSME tracking, and banking integrations are built in. Pricing scales as you grow.
If you run Tally and want vendor ratings in weeks, not months, AI Accountant provides a pragmatic path to automation.
Conclusion
A well designed supplier performance dashboard turns reactive firefighting into proactive, data driven partnership management. Combine delivery, quality, commercial, and compliance views to gain complete supplier visibility and measurable business outcomes.
Select an approach that matches your stage: dedicated platform for complexity, finance led stack for speed and ROI. Start with top suppliers and core metrics. Expand as processes mature.
Use scorecards to collaborate, not just criticize. Recognize excellence, invest in improvement, and build resilient supply chains that support growth and customer satisfaction.

A results-driven finance and sales professional with hands-on experience through finance internships and a fast-paced sales role. With a strong interest in accounting and business finance, Harsh focuses on turning complex topics into clear, practical takeaways for founders and finance teams.