Key takeaways
- AI-powered accounting insights are decision signals drawn from your GL, AR, AP, bank feeds, and invoices, they help your CA team spot patterns, predict cash gaps, and flag risks before they become problems.
- The AI dashboard is a visibility tool, not a DIY accounting cockpit. Founders track cash, receivables, payables, and tax flags while the CA team handles all execution.
- Confidence scores and prediction ranges frame uncertainty. Tighter bands mean cleaner data, wider bands signal volatility or incomplete periods, your CA team interprets both before acting.
- Every AI signal goes through a validation checklist, source tracing, one off exclusions, tagging checks, and seasonality reviews, before any booking or filing decision.
- Common insight categories include cash flow forecasts, AR aging risk, AP discount capture, GST mismatch flags, anomaly detection, and variance driver analysis.
- The outcome is timely filings, controlled cash, and reliable MIS, powered by CA oversight plus AI signals. Platforms like AI Accountant's MIS reporting help CA teams surface these insights faster from reconciled data.
AI Accounting Dashboards: What's New in 2026
Until early 2025, GST e-invoicing applied only to businesses with turnover above ₹5 crore. From August 2025, that threshold dropped to ₹1 crore, pulling a significantly larger set of SMEs into mandatory e-invoicing under CBIC's phased rollout. For AI finance dashboards, this means more structured invoice data flowing in, which tightens prediction ranges and improves anomaly detection, but only if your e-invoice tagging is clean.
The operational shift is real. Businesses that previously filed GST with manual purchase registers now need IRN generation on every B2B invoice. AI dashboards that ingest e-invoice JSON data can auto-reconcile against GSTR 2B with fewer mismatches. But if IRN fields are missing or place-of-supply codes are wrong, the dashboard flags false anomalies. Your CA team now spends more time validating e-invoice compliance upstream rather than chasing reconciliation gaps downstream.
Who does this hit hardest? SMEs in the ₹1 crore to ₹5 crore turnover band, especially those on Tally who haven't configured e-invoice APIs yet. If you ignore this, expect blocked ITC claims, penalty exposure under GST portal rules, and wider confidence bands on your cash flow forecasts because the AI model can't trust incomplete invoice data.
What to do now:
- Confirm your Tally or accounting system generates IRNs for all B2B invoices above the threshold.
- Ask your CA team to run a GSTR 2B reconciliation for the last two months and flag any missing e-invoice tags.
- Review your dashboard's anomaly flags, if false positives have spiked since mid-2025, incomplete e-invoice data is likely the cause.
Teams using automated GST reconciliation workflows are seeing cleaner matches because the system cross-references IRN data, purchase registers, and GSTR 2B in one pass, reducing manual chase work.
What CA-led Virtual Accounting means
Your Virtual Accounting is fully managed by a Chartered Accountant team. They own bookkeeping, GST, TDS, income tax, and compliance. The AI accounting dashboard provides live visibility into your financial health.
The CA team runs the books, posts ledger entries, reconciles bank feeds, prepares returns, and closes months with controls and documentation. This is not a tool you operate yourself. It is a managed service with professional oversight, similar to models described in ICAI's guidance on outsourced accounting services.
Founders get clarity and control without lifting a finger in the ledger. The dashboard shows what is happening, your CA team decides what to do next.
The service is built for outcomes: clean books, timely filings, reliable MIS, and cash discipline.
Why AI accounting software dashboards matter for visibility, not DIY
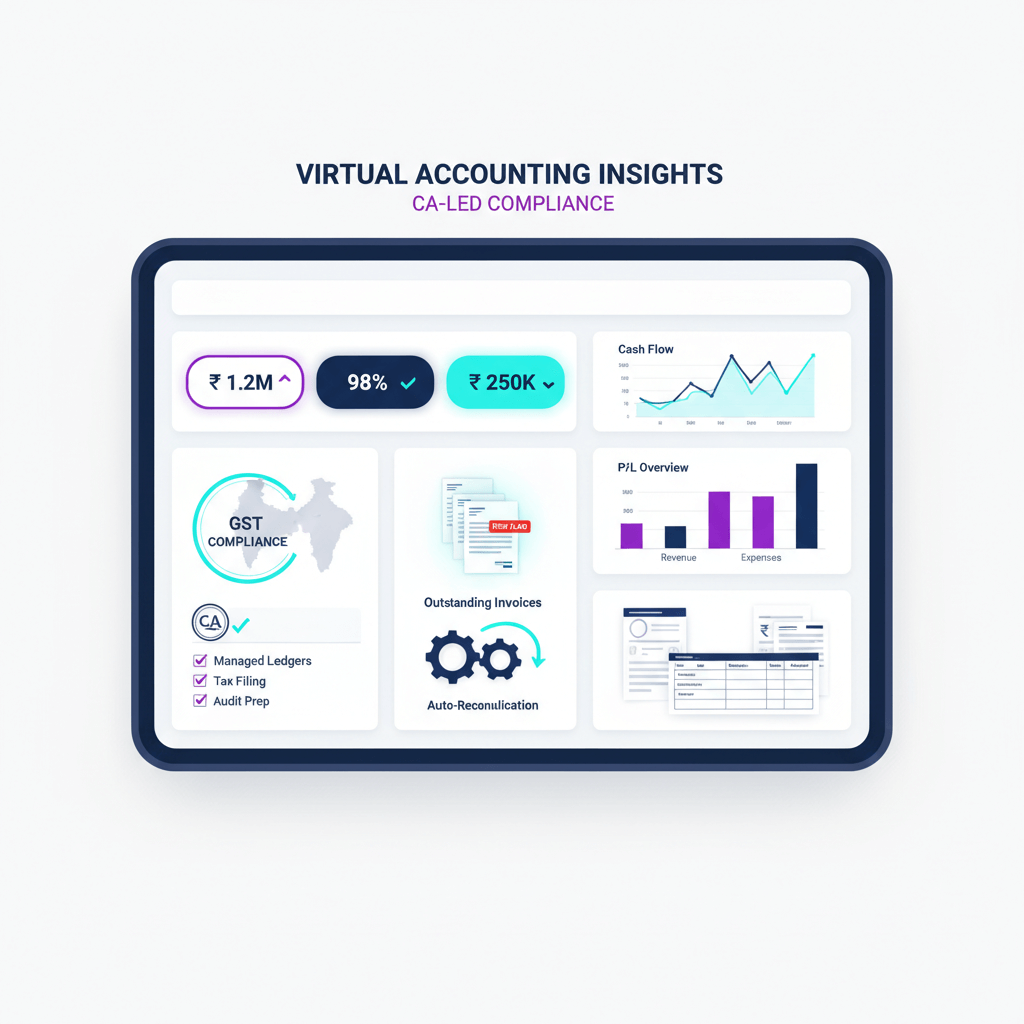
Think of the dashboard as your window into the books, not an accounting cockpit. You track cash, AR, AP, tax flags, and risks. Your CA team executes.
A good AI finance dashboard presents decision signals clearly and keeps founders focused on strategy, not data entry.
AI surfaces decision signals: pattern detection, predictions, and suggested actions. The CA team validates and operationalizes each one. This separation between visibility and execution is what makes AI-powered accounting insights useful without being dangerous.
How AI insights are interpreted by your CA team
What an AI accounting insight actually is
An insight is actionable intelligence produced from GL, AR, AP, bank feeds, and vendor invoices. It supports a decision, not a static report. Insights typically do four things:
- Find patterns you may not notice during manual reviews.
- Predict outcomes, for example a cash gap or a late payer.
- Flag risks, anomalies, or potential fraud signals.
- Suggest actions, for example timing a vendor payment to capture a discount.
Understanding what are AI-driven accounting insights helps founders see that the value is not in the data itself, but in the interpretation layer your CA team applies on top.
How AI insights differ from standard reports
Reports tell you what happened: balances, totals, and variances. They are backward looking.
AI-powered accounting insights are dynamic and forward looking. They answer predictive, anomaly, explanatory, and prescriptive questions, and update as new data arrives. For example, a report shows your AR balance. An insight tells you which specific customer is likely to pay late next month and by how much.
The anatomy of an insight in an AI finance dashboard
Most insights arrive with simple parts you can scan fast:
- A headline metric tile plus a small trend line.
- An alert flag for urgency, typically red or amber.
- A short narrative, for example AR aging risk up due to a specific customer.
- A drill down to the source transactions and ledger entries.
Visual cues matter. Ranges show uncertainty, flags show severity, trend lines show direction. The best AI accounting dashboards keep these elements scannable so your CA team can triage quickly.
Reading the numbers: intervals, scores, trends, narratives
- Prediction intervals vs point estimates: plan for the band, not a single number.
- Anomaly scores: high scores mean unusual, not proven fraud. Always drill into the underlying transactions.
- Trend vs seasonality: avoid confusing seasonal dips with new declines. Your CA team checks historical patterns before escalating.
- Correlation vs causation: use drill downs to find real drivers. A spike in vendor spend and a revenue dip may be coincidental.
Why you see confidence scores and ranges
Confidence scores and ranges convey reliability. They arise from the method used:
- Time series for cash and revenue forecasts.
- Classification or clustering for late payers and fraud flags.
- Rules plus machine learning for AP timing and duplicate checks.
- Language models on invoice text for descriptions and vendor grouping.
More clean, stable data yields tighter ranges and higher confidence. Volatile periods widen the band. When your business changes pricing, credit terms, or channels, expect the model to show lower confidence until it recalibrates. This is normal and healthy, not a flaw.
Data provenance and quality checks
Insight quality follows data quality. Expect reconciled core sources:
- GL entries, AR and AP records, bank feeds, and invoices.
- At least 12 to 24 months of detailed history.
- Clean categorization of vendors and expense types.
- Bank and GL reconciled before running any AI analysis.
In India, watch GST ledger mismatches or missing e-invoice tags. They can distort tax flags and widen confidence bands on your dashboard. With the e-invoicing threshold now at ₹1 crore, more businesses need to ensure IRN data flows cleanly into their accounting system. The GST portal's e-invoice system documentation covers the required fields and validation rules.
Quick validation checklist before action
- Trace the signal to source transactions in GL or bank.
- Exclude known one-offs: bonus payouts, refunds, one-time advances.
- Check vendor and category tagging consistency.
- Sanity check assumptions: payment terms, usual collection lags, seasonality.
- Review confidence. Above seventy percent is workable. Lower needs more human review.
Validate the data, then act on the drivers. That is how your CA team turns signals into controlled decisions.
Limitations that can skew AI accounting insights
- Partial period data or reconciliation backlogs can swing signals. Watch missing bank days or uncleared entries.
- Model drift when business changes (pricing, credit terms, or channels). Expect lower confidence and wider ranges.
- Changing mix or small samples. A few large invoices dominate the pattern. Treat such periods as exploratory.
- Automation bias. Never accept every alert. Apply the checklist and drill down into the underlying ledger entries.
For broader perspective on how AI is reshaping the profession, the Institute of Chartered Accountants of India has published guidance on technology adoption for CA firms.
Common insight categories founders see
- Cash flow forecasts and liquidity alerts: read the range, timing window, and top drivers of inflows and outflows.
- AR collection likelihood and aging risk: high risk beyond forty-five or sixty days needs follow up.
- AP timing and discount capture: confirm vendor terms and working capital needs before acting.
- Revenue and expense forecasting: compare trend lines with budget variance.
- Variance explanations and driver analysis: attribution by vendor, category, region, or channel.
- Anomaly and outlier detection: open the transactions for duplicates, round amounts, or weekend postings.
- Duplicate or erroneous transactions: correct before GST filings to avoid mismatch.
- Vendor spend consolidation patterns: many small vendors in a category may signal a negotiation opportunity.
- Margin and unit economics breakdown: confirm allocations, freight, discounts, and returns.
- Fraud risk indicators: suspicious timing, split bills, or unusual vendor bank changes. Escalate high severity alerts.
- Tax or GST anomaly flags: mismatches between purchase register, GSTR 2B, and ledger. Wrong place of supply or TDS rate.
Worked example: a 4 week cash shortfall alert
Alert: a seventy percent chance of a fifteen lakh to twenty-five lakh shortfall in four weeks. Treat seventy percent as moderate confidence. Treat the range as the likely gap band, not a single number.
Likely inputs used: AR aging beyond forty-five days, scheduled AP (rent, GST, and payroll outflows), and base assumptions on collection lags.
Verification steps:
- Reconcile bank feeds to today.
- Exclude one-offs.
- Check seasonality around month end.
- Confirm confidence. If below seventy percent, widen your caution band.
Decision framing: after validation, pull two levers. Speed up AR with debtor calls or small early payment benefits. Defer non-urgent AP where terms allow. Align with tax and payroll dates to avoid penalties.
The Income Tax Department's advance tax calendar is worth checking alongside your cash forecast, since quarterly instalments can create predictable outflow spikes that the AI model factors into its projections.
Engagement model and deliverables
Your CA team onboards, maps your chart of accounts, sets vendor and customer tagging, connects bank feeds, and migrates opening balances.
Monthly routines: bookkeeping, bank and GL reconciliations, AR and AP reviews, MIS with AI-powered accounting insights, GST and TDS filings, and income tax compliance.
Quarterly routines: board-ready MIS and tax reconciliations.
Year end: audit support, schedules, and statutory filings.
The dashboard stays live for visibility. Your CA team handles execution and decisions, guided by validated AI signals. Typical migrations complete in two to four weeks, depending on data cleanliness and opening balance agreements.
FAQ
What are AI-driven accounting insights?
AI-driven accounting insights are actionable signals generated by analyzing your GL, AR, AP, bank feeds, and invoices using machine learning and pattern detection. They predict outcomes like cash shortfalls, flag anomalies like duplicate invoices, and suggest actions like accelerating debtor follow-ups. Unlike static reports, they update dynamically as new data arrives and include confidence scores so your CA team knows how much weight to give each signal.
How does an AI accounting dashboard fit into a CA-managed service?
The AI accounting dashboard surfaces decision signals such as cash gaps, late payer risk, anomalies, and suggested actions. Your CA team validates each signal against source transactions, reconciles the data, and executes changes. Founders use the dashboard for visibility. The CA team uses it for triage and action.
Can I rely on AI insights for cash decisions without human review?
No. Insights are decision signals, not final commands. The CA team applies a quick validation checklist: source tracing, reconciliation checks, one-off exclusions, and seasonality reviews before acting. This reduces automation bias and prevents errors from partial period data or misclassifications.
How are GST, TDS, and income tax covered in a CA-managed model?
GST (purchase register, sales register, GSTR 2B reconciliation, and return filing) is managed end to end by the CA team. TDS computation and returns are prepared and filed with schedules and challans. Income tax advance tax reviews and annual filings are planned with audit support. With the e-invoicing threshold now at ₹1 crore, the CA team also validates IRN generation for all qualifying B2B invoices before filing. (2026 update)
What happens when business patterns change, for example a pricing shift or a new channel?
Models see drift, confidence falls, and ranges widen. The CA team revalidates assumptions, adjusts tagging, updates budgets, and treats early periods as exploratory until new patterns stabilize. This is expected behavior, not a system failure.
How fast can you migrate from Tally to an AI-enabled Virtual Accounting setup?
Typical migrations complete in two to four weeks, depending on data cleanliness and opening balance agreements. The CA team maps accounts, normalizes vendor and customer tags, and backfills twelve to twenty-four months of history for reliable insights.
What is the difference between an AI finance dashboard in India and a standard accounting report?
A standard report shows historical balances, totals, and variances. An AI finance dashboard adds forward-looking signals: cash forecasts with confidence ranges, AR collection probabilities, anomaly flags, and driver attribution. It updates continuously as transactions flow in, and highlights what needs attention now rather than summarizing what already happened.