-01%201.svg)
Key takeaways
- The top features of accounting dashboards centre on action, not data: every KPI (cash runway, DSO, margins, compliance status) maps to a specific next step so founders decide fast without opening ledgers.
- A CA team handles bookkeeping, GST, TDS, income tax, MCA filings, and monthly closes end to end, while the AI dashboard provides real time visibility, alerts, and trend context for confident decision making.
- Working capital metrics like AR aging, DPO, and cash conversion cycle surface stuck cash and payment timing issues, turning collection and payment decisions into a five minute review instead of a spreadsheet hunt.
- Burn rate tied directly to cash runway means founders see the impact of any spend spike instantly, with red, amber, green flags triggering cost control before runway shrinks to a danger zone.
- India specific compliance panels (GSTR 3B, GSTR 1, TDS challans, advance tax, MCA filings) prevent missed deadlines, penalties, and last minute scrambles.
- When reconciliation gaps or aging exceptions pile up, platforms like AI Accountant's MIS reporting surface them early so the CA team resolves issues before they compound.
Best Accounting Dashboard Key Features: What's New in 2026
Dashboard design has shifted meaningfully since early 2025. Until March 2025, GST e-invoicing applied only to businesses above ₹5 crore turnover. From April 2025, CBIC lowered the threshold to cover a much wider set of SMEs, as outlined in CBIC's e-invoicing notifications. This means accounting dashboards now need to track e-invoice generation status and IRN validation alongside traditional GSTR 3B and GSTR 1 filing views. If your dashboard doesn't flag missing IRNs before the filing deadline, you risk ITC claims being rejected.
On the burn rate side, advanced accounting systems integrating burn rate metrics into dashboards have become table stakes rather than a premium feature. In 2025, most founder dashboards showed burn as a standalone number. In 2026, the expectation is that burn connects directly to scenario models: what happens to runway if you add two hires, or if a large receivable slips by 30 days. Dashboards that lack this linkage leave founders guessing during critical cash decisions.
The operational shift is clear. Finance teams now expect:
- Auto flagging of e-invoices not generated within 24 hours of invoice creation
- Burn rate projections that update weekly based on actual payroll, vendor payments, and committed spend
- Compliance calendars that pull due dates from the GST portal and income tax portal automatically, not manually maintained spreadsheets
Firms that ignore these shifts face tangible costs: interest at 18% per annum on delayed GST payments, ITC reversals for non compliant invoices, and blocked filings when e-invoice requirements are unmet. If you are still running a static compliance tracker, the window to upgrade is now, not next quarter.
For teams already on Tally, automated bookkeeping workflows now handle e-invoice data capture and reconciliation as part of the daily close, reducing the manual overhead that the new thresholds create. Combined with GST reconciliation automation, the gap between invoice generation and return filing shrinks to hours instead of days.
CA-led Virtual Accounting, powered by AI dashboards
Founders want fast clarity without opening ledgers. In a CA-managed Virtual Accounting service, the accounting team handles end to end books, GST and TDS filings, corporate tax and MCA compliance, and monthly closes. An AI dashboard gives a clean executive lens.
The philosophy is simple: decisions over data dumps. The dashboard makes action obvious, the CA team makes execution reliable.
Executive views that balance liquidity, revenue, and profit help founders act confidently. For context on best accounting dashboard key features and high impact founder views, see ICAI's guidance on financial reporting standards and financial dashboard structures.
Guiding principle: If a KPI turns red, the next step is clear: collections, payment timing, pricing, or spend control. No digging into raw ledger entries is needed.
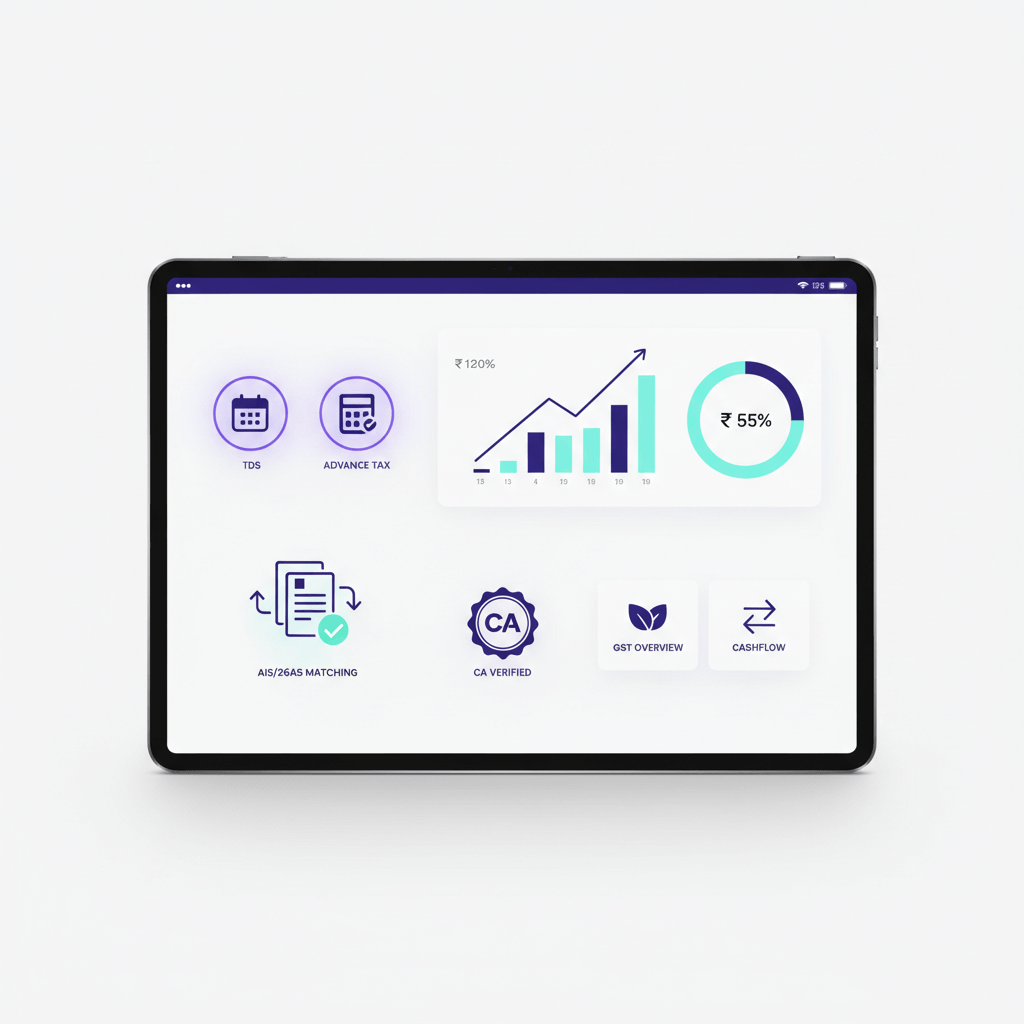
Snapshot header: instant health check
The top view answers one question fast: are we fine today.
What's visible at a glance:
- Cash and bank balances by account, plus total accessible cash.
- Net working capital: current assets minus current liabilities.
- Cash runway in months: current cash divided by monthly burn.
- Last updated timestamp and named data sources such as ERP and bank feeds. Trust starts with freshness.
- Optional red, amber, green flags for thresholds. For example, runway below three months shows red.
These elements anchor reliable daily decisions. A well designed snapshot header is one of the top features of accounting dashboards because it answers the "are we okay" question in under ten seconds.
Liquidity KPIs
Liquidity shows whether near term obligations can be met without stress. Get this wrong and payments bounce, vendor trust drops, and penalties pile up.
- Current ratio: current assets divided by current liabilities. Low means tight cash and risk.
- Quick ratio: current assets minus inventory divided by current liabilities. A stricter view of short term safety.
- Undrawn credit lines and facilities: with upcoming principal and interest due, this shows buffer versus cash calls.
CFO ready KPIs ensure the founder knows when to draw facilities or slow spend. For broader context on finance leadership metrics, see Oracle's CFO KPI frameworks.
Receivables and payables: working capital efficiency
Cash can get stuck in receivables or leave too fast via early vendor payments. The dashboard makes the cycle visible and actionable.
- Accounts receivable aging buckets: 0 to 30, 31 to 60, 61 to 90, and 90 plus days. Total overdue and top overdue customers for targeted calls.
- Days sales outstanding with trend: if DSO rises, tighten credit, follow up sooner, or offer early pay incentives.
- Accounts payable aging: total overdue and top vendors due soon. Plan payments to avoid late fees and maintain terms.
- Days payable outstanding with trend: balance vendor goodwill and cash health.
- Cash conversion cycle: DSO plus days inventory outstanding minus DPO. Shorter equals faster cash back.
These working capital metrics are among the best accounting dashboard key features for founders who want to see exactly where cash is stuck. Matching vendor invoices to purchase orders and flagging discrepancies automatically saves hours of manual reconciliation every week.
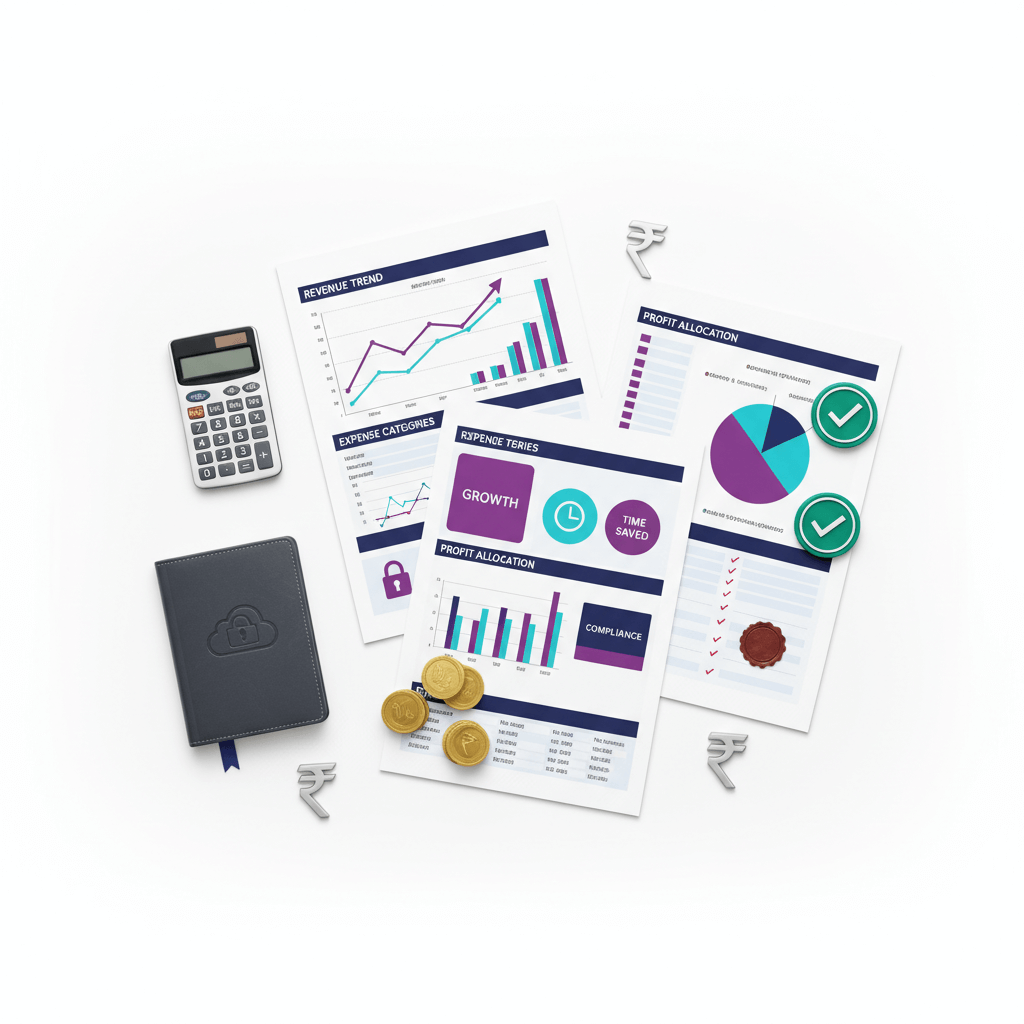
Revenue and growth visibility
Top line needs plan context. Without it, a bad week triggers panic or a slow slide goes unnoticed.
- Month to date, quarter to date, and year to date revenue versus budget or target with variance.
- Trailing twelve month trend to smooth seasonality.
- Recurring versus one off revenue. Durability helps planning.
- Top customer and product contribution. Concentration risk: if one customer exceeds a third of revenue, plan mitigation.
Compare actuals to plan and use longer trends to steady decisions. For practical frameworks on dashboard metrics, review finance dashboard metric guides.
Profitability metrics
Profitability confirms whether the model creates value, not just revenue.
- Gross profit and margin percent: pricing and direct cost discipline.
- Operating profit such as EBIT or EBITDA and margin percent: core efficiency before financing and tax.
- Net profit and net margin percent: the bottom line.
- Contribution margin by product or service: unit economics for pricing, discounting, and mix decisions.
Executive dashboard standards highlight margin leaks and corrective actions. When you see gross margin dipping, the dashboard should point you toward the product line or cost centre causing the leak, not just the number itself.
Expenses and burn: advanced accounting systems integrating burn rate metrics into dashboards
Costs decide runway. If burn rises without control, cash depletes fast. This is why advanced accounting systems integrating burn rate metrics into dashboards has become a non negotiable feature for startup and SME finance teams.
- Operating expenses by category: payroll, rent, marketing, and others with monthly trend and variance to budget.
- Monthly cash burn: net cash outflow, directly linked to runway decisions.
- Variable versus fixed cost mix: reduce variable first in a downturn. Prepare playbooks for fixed adjustments.
The key shift in 2026 is that burn rate is no longer a standalone metric. It connects to scenario planning: what does runway look like if you onboard three new clients, or if a ₹15 lakh receivable slips by 45 days? Dashboards that show this linkage help founders make spending decisions with confidence instead of gut feel.
Cash flow and short term forecast
Cash flow explains movements beyond profit. Short term forecasting prevents surprises.
- Operating, investing, and financing cash flows for the current period and trailing twelve months.
- Free cash flow: cash from operations minus capital spend. This shows capacity to grow and service debt.
- Four to twelve week cash forecast based on scheduled receivables, payables, payroll, and known commitments.
Founder dashboards should include these KPIs for planning. The forecast view is especially powerful when combined with burn rate trends, giving a forward looking picture rather than just a historical snapshot.
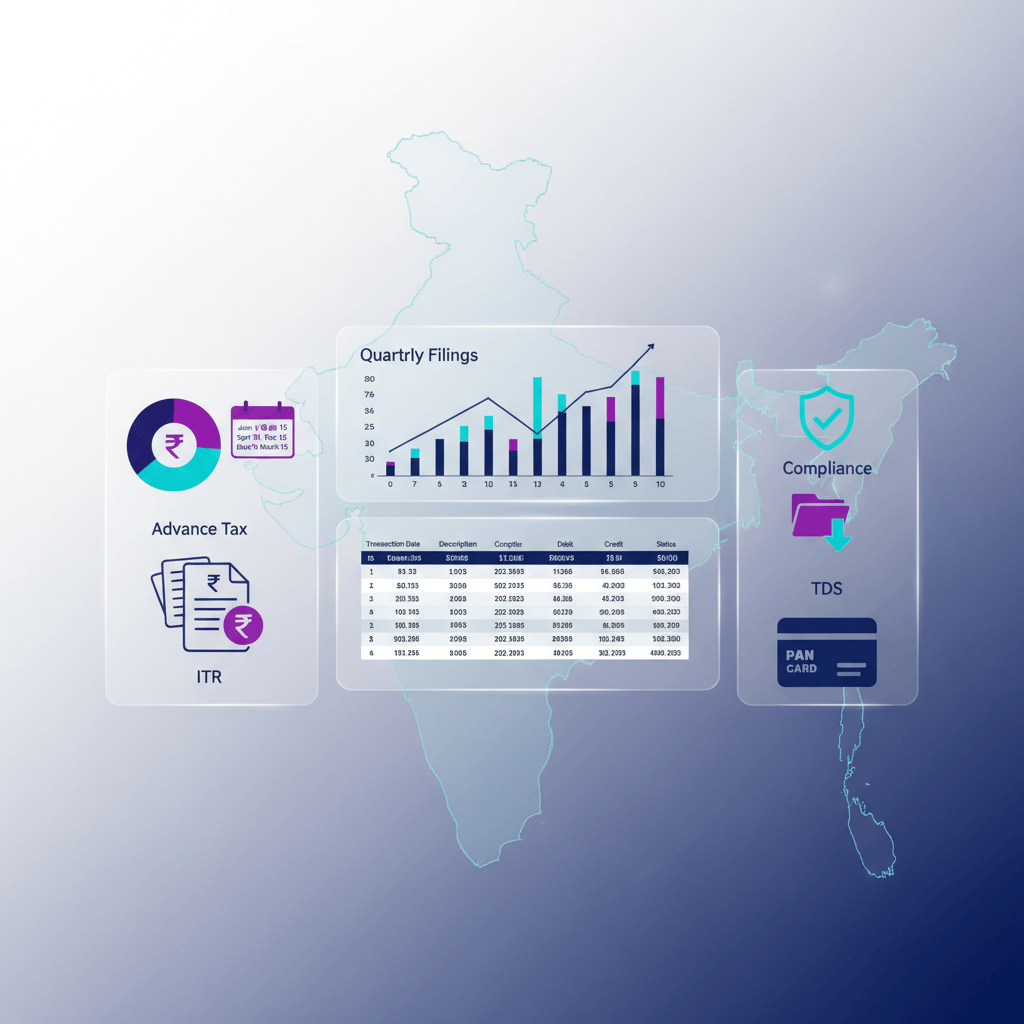
Tax and compliance: India specific
Compliance misses lead to interest, penalties, and notices. The CA team runs filings, the dashboard keeps status visible.
- GST return status such as GSTR 3B and GSTR 1 with upcoming deadlines.
- TDS filing status and challan payments with due dates.
- Corporate income tax status and advance tax schedules.
- MCA annual filings and audit status with due or overdue alerts.
- Flags for statutory payments marked paid, due, or overdue.
- E-invoice generation status and IRN validation, now relevant for a wider set of businesses after the 2025 threshold changes.
Embedding compliance status prevents last minute scrambles and fines. For official filing calendars and notification updates, refer to the GST portal and Income Tax Department portal.
Controls and exceptions
Controls protect data quality and cash. The CA team maintains hygiene, the dashboard surfaces exceptions.
- Bank reconciliation status by account and date.
- Unreconciled transaction count and nature.
- Suspense or exception account balance and aging.
- Aging of open accounting tasks such as missing invoices or unmatched receipts.
These views reduce errors and prevent leaks. A dashboard that surfaces a ₹2 lakh unreconciled suspense balance within 48 hours is far more valuable than one that waits until month end close to flag the gap.
Benchmarking and targets
Targets turn metrics into guardrails for timely action.
- KPI targets beside each metric. For example, DSO target, minimum cash buffer, margin goals.
- Red, amber, green indicators when thresholds are breached.
- Controls to adjust targets by business cycle or seasonality.
For practical target setting approaches, browse finance dashboard metric frameworks.
Segmentation and drill down
Averages hide issues. Filters and drill downs reveal them without exposing raw ledger entries to founders.
- Filters for period, business unit, product, geography, and customer segment.
- Per customer AR snapshots for collections prioritisation.
- Per vendor AP summaries for payment planning.
These tools convert a high level view into actionable clarity. A founder reviewing a per customer AR snapshot can spot that one client owes ₹8 lakh overdue by 60 days and trigger a collections call in the same sitting.
Context and definitions panel
Definitions and assumptions prevent misreads and wrong fixes.
- KPI formulas and definitions. For example, DSO equals accounts receivable divided by revenue per day, where revenue per day equals revenue divided by 365.
- Notes for one offs or seasonal impacts. For example, large prepayments or festive spikes.
- Data source assumptions and exclusions. For example, disputed invoices excluded from AR, or cash balances limited to accessible accounts.
Clear definitions make KPIs consistent and trusted. Without them, two people looking at the same dashboard number can reach different conclusions about what it means and what to do about it.
Engagement model, cadence, and deliverables
Scope: Bookkeeping, GST and TDS, corporate tax, MCA filings, payroll compliance, reconciliations, monthly and annual closes, and audit support are fully managed by the CA team. Founders get a clean AI dashboard for visibility, alerts, and planning.
- Onboarding: Data source mapping, chart of accounts standardisation, opening balance review, target setting, and threshold configuration.
- Cadence: Daily or weekly cash and alert reviews. Monthly performance and trend reviews. Quarterly strategy checkpoints.
- Deliverables: Closed books with trial balance, compliance calendar status, exception resolution log, dashboard access with role based views.
Founders do not post entries. Founders decide on actions. The CA team executes.
Virtual CFO services typically operate on tiered pricing models. Smaller businesses receive monthly oversight, cash flow management, and financial reporting. Larger businesses add budgeting, forecasting, strategic planning, debt management, and capital investment advisory. Pricing scales by service level, with firms positioning these as value added services that deliver high level financial insight rather than commodity bookkeeping.
Bringing it together
The founder needs an accounting dashboard that starts with cash and runway, moves through liquidity and working capital speed, tracks revenue and profit against targets, ties expenses to burn and cash flow, embeds India compliance, and keeps controls and definitions in view.
Every KPI maps to a direct action. If something turns red, you know what to do next.
The best accounting dashboard key features are not about having more charts. They are about having the right metrics, connected to clear thresholds, with a CA team behind them ensuring the numbers are clean and the filings are done. That combination of execution and visibility is what turns a dashboard from a reporting tool into a decision engine.
FAQ
What is CA-led Virtual Accounting, and how does the AI dashboard fit in?
CA-led Virtual Accounting means a chartered accountant team runs your books, GST and TDS, corporate tax, MCA filings, reconciliations, and closes end to end. The AI dashboard is an executive window for visibility, tracking, and comfort. It highlights KPIs, trends, and alerts so founders decide while the CA team executes. An "AI Accountant" service typically adds automated data capture, reconciliation assistance, and real time alerts to this CA-managed backbone.
What are the top features of accounting dashboards that founders should look for?
The top features are cash and runway snapshot, AR and AP aging with DSO and DPO trends, burn rate linked to runway projections, India specific compliance tracking (GST, TDS, MCA), and red, amber, green threshold alerts that map every metric to an action. Segmentation filters and a definitions panel round out the must haves, ensuring numbers are both actionable and trustworthy.
How do advanced accounting systems integrate burn rate metrics into dashboards?
Advanced systems pull actual payroll, vendor payments, and committed spend data to calculate net cash outflow automatically, then connect burn to runway and scenario models. Instead of a static monthly number, the dashboard updates burn weekly and shows what happens to runway under different spend or collections assumptions. This is a significant shift from 2025, where burn was typically displayed as an isolated figure without forward projections. (2026 update)
What KPIs should a founder see daily versus monthly?
Daily or weekly, review cash and bank balances, net working capital, cash runway, and critical alerts on overdue GST or high DSO. Monthly, review revenue versus budget, gross and operating margin, burn rate, cash flow statements, and compliance calendars.
How are GST, TDS, income tax, and MCA compliance managed and tracked?
The CA team maintains the compliance calendar and files returns on schedule. The dashboard shows GSTR 3B and GSTR 1 statuses, TDS filings and challans, advance tax schedules, and MCA annual filings with due and overdue flags. From 2025 onward, e-invoice generation status and IRN validation are also tracked, reflecting expanded e-invoicing thresholds. (2026 update)
How do we set realistic targets for DSO, margins, and cash buffers?
Targets are set using historical trends, seasonality, customer mix, and sector benchmarks. The dashboard displays targets next to actuals and uses threshold based alerts to trigger action when a metric drifts. Quarterly reviews help adjust targets as the business cycle shifts.
How do founders stay in control without touching the books?
Control comes from visibility and approvals. The AI dashboard provides snapshots and trends, the CA team proposes actions with rationale, and founders approve collections strategies, payment schedules, and budget shifts. Monthly closes and audit trails keep governance tight, while the dashboard keeps the narrative clear.