-01%201.svg)
Key takeaways
- A well designed break even analysis dashboard India clarifies units and revenue needed to break even, surfaces gaps to target, and models sensitivity to price and cost changes across products, channels, and regions.
- Always compute contribution and BEP using net of GST figures, this alone prevents overstated margins and flawed decisions.
- Combine KPI tiles, CVP charts, contribution waterfalls, and margin of safety alerts, your team gets instant, actionable signals.
- Automate data ingestion and classification with AI Accountant, reduce manual work dramatically while standardizing rules and assumptions.
- CA firms can productize dashboards, commentary, and scenario reviews, turning insights into recurring revenue with measurable client impact.
Table of contents
Why Break Even Matters in India Today
In India’s competitive markets with thin margins, GST complexities, heavy discounts, and seasonal swings, a modern dashboard is not a luxury, it is survival. Your D2C brand sells on Amazon, Flipkart, and your own site, each channel carries different fees, festival season introduces deep discounting, GST complicates reporting, so the simple question is, are you actually making money?
That is where a focused break even analysis dashboard India shines, it reveals the precise volume or revenue needed to break even, the gap versus current sales, and the sensitivity of profitability to price changes, variable costs, or fixed cost creep per product, per channel, and per region.
Core idea: Know the exact point where total revenue covers total costs, then protect your margin of safety rigorously, especially during sales and returns heavy periods.
For conceptual depth, see break even analysis and what is break even analysis and how to do it for foundational references, then tailor every calculation to India’s GST reality.
Core Concepts Refresher with India Context
Fixed costs remain unchanged with output, think rent for a Bengaluru office, salaries for permanent staff, insurance, SaaS subscriptions, AMC contracts, and monthly retainers, that ₹50,000 rent does not change whether you sell 100 or 1,000 units.
Variable costs scale with volume, materials, payment gateway fees at 2 to 3 percent, shipping charges across metros and tier 2 routes, packaging, and returns handling, every extra unit sold adds variable costs.
Contribution per unit equals net selling price minus variable cost per unit, netting GST first, for a product sold at ₹1,180 including GST, net price is ₹1,000, variable cost ₹400, contribution ₹600.
Contribution margin ratio or P/V ratio equals contribution divided by net sales, a 40 percent ratio means every rupee contributes 40 paise to fixed costs.
Break even point is where you neither profit nor lose, units BEP equals fixed costs divided by contribution per unit, revenue BEP equals fixed costs divided by P/V ratio, see break even point for a quick refresher.
Margin of safety shows how much actual or projected sales exceed BEP, expressed in units, revenue, and percentage, this is your buffer during slow months or aggressive discounting.
Keep everything net of GST in contribution and BEP computations, use gross figures only for statutory reporting, for more background, review break even analysis.
What to Include in a Break Even Analysis Dashboard
KPI Tiles for Quick Health Checks
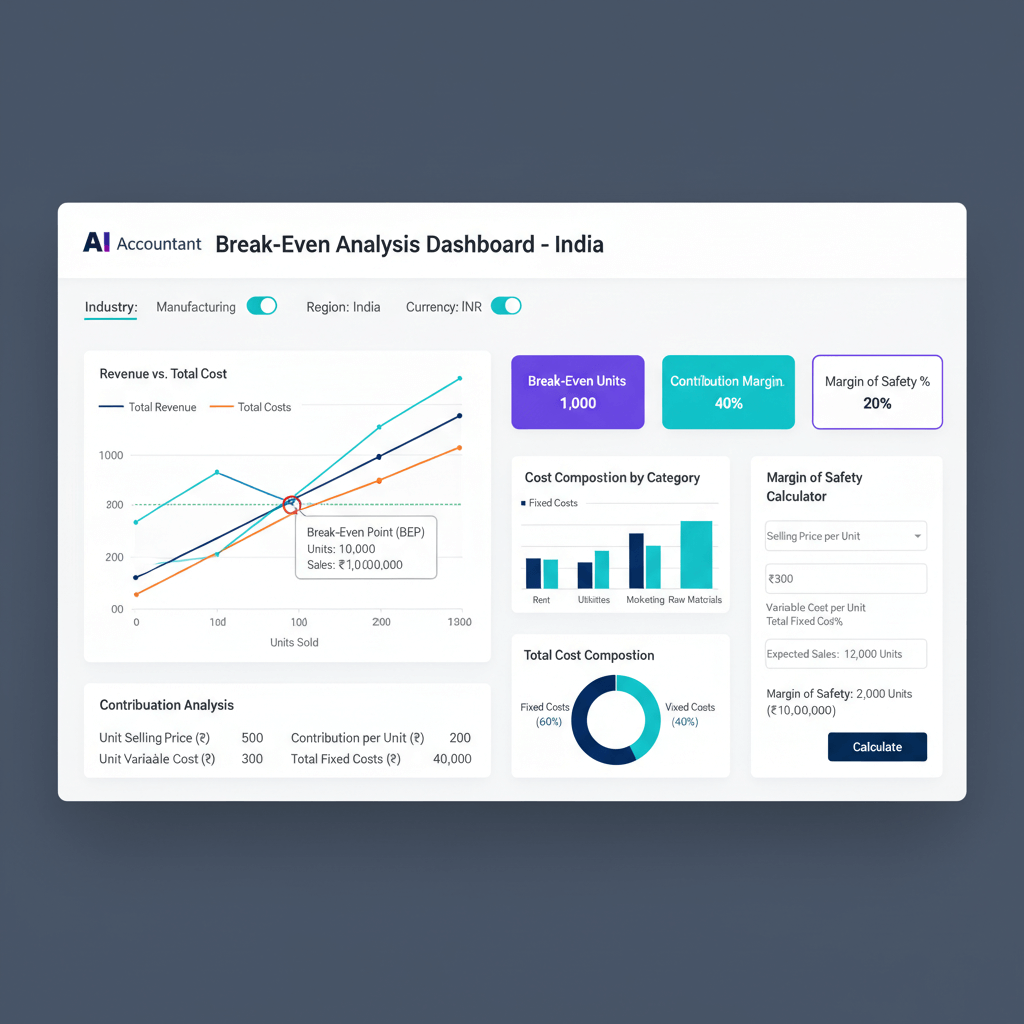
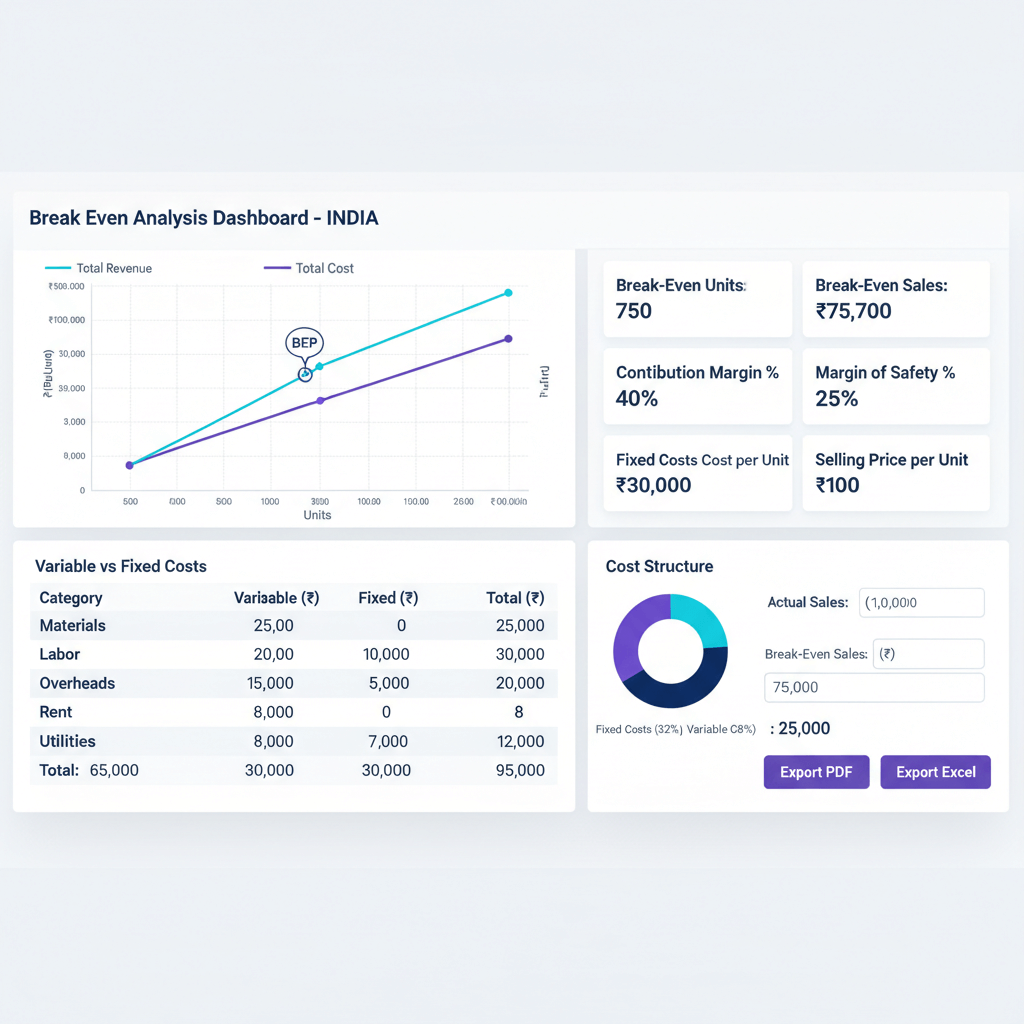
Display break even units and revenue, current units and revenue, and the gap to BEP front and center. Add margin of safety in units, revenue, and percentage, plus contribution margin percentage and fixed cost coverage ratio. These tiles turn raw math into quick decisions, one glance, one action.
Visual Elements That Tell the Story
Use a CVP chart for costs and revenue against volume, show the break even point and profit zones clearly, add contribution waterfalls by product or channel so you learn which SKUs or channels carry the business, include trend lines for fixed cost tracking and unit contribution over time, sudden rises or falls demand immediate attention.
For concept references, revisit break even analysis before you finalize visual logic.
Variable Cost Dashboard for Granular Analysis
Track per unit variable costs by SKU and channel, break down gateway fees, shipping, packaging, returns, credit notes, and discounts, show both pre and post GST views to understand true economics, monitor monthly trends and configure alerts when variable costs breach thresholds.
Fixed Cost Tracking to Control Creep
Monitor rent, salaries, SaaS, AMC, and semi variable utilities monthly, split semi variable items properly, for example, mobile bills with fixed rental plus usage charges, track fixed costs as a percentage of revenue, if the ratio climbs, you are becoming less efficient, act quickly, see break even analysis guidance for discipline on interpreting shifts.
Contribution Analysis Tools for Strategic Decisions
Build product wise, channel wise, and region wise contribution metrics, display P/V ratios per segment, add sensitivity sliders to show impact of price increases or cost hikes, for inspiration, read break even analysis examples to frame robust scenarios.
Margin of Safety Calculator as Early Warning System
Auto compute margin of safety from current sales and BEP, set scenario inputs for price changes, inflation impacts, and volume dips, configure alerts when margin of safety falls below threshold, reference break even analysis examples and break even analysis for calibration ideas.
Data Sources and India Stack Alignment
Integrate Zoho Books or Tally for invoices and bills, connect bank and card statements for complete costs, pull sales data from marketplaces and D2C platforms for real time revenue, then net out GST on revenue and variable costs before contribution calculations, map returns, discounts, shipping, and gateway fees carefully, standardize formats across sources, and schedule refreshes daily for high velocity businesses, weekly for others.
For a grounding in accuracy, bookmark break even point and keep definitions consistent across your reports.
Step by Step Dashboard Building Process
Step 1: Define Your Scope
List your SKUs or services, choose units of measure, document assumptions for fixed versus variable, and clarify shared cost treatment, clear definitions prevent rework.
Step 2: Set Up Data Ingestion
Use AI Accountant to ingest Zoho Books or Tally automatically, connect gateways, shipping partners, and channels, validate completeness, deduplicate entries, and fix classifications before modeling, a clean base ensures reliable BEP.
Step 3: Classify Costs Correctly
Let AI Accountant map costs as fixed or variable using learned patterns, then review and refine, create rules for semi variable costs like mobile rentals plus usage, and document edge cases such as one time setup fees or seasonal staff, for clarity, revisit break even analysis as your conceptual anchor.
Step 4: Build Your Contribution Model
Compute contribution per unit by SKU and channel using net of GST figures, calculate P/V ratios per segment, validate against actual margins, if contribution looks overstated versus gross margin, reconcile inputs and assumptions.
Step 5: Calculate Break Even Points
Compute BEP in units and revenue, create scenarios for peak season, off season, discount heavy periods, and commission changes, keep BEP dynamic with cost updates, for fundamentals, see break even analysis.
Step 6: Design Visualizations and Alerts
Build drill downs for variable costs, highlight month over month changes in fixed costs, include sliders and toggles for price and scenario shifts, configure alerts for low margin of safety, rising variable costs, or fixed cost creep, you want proactive signals, not postmortems.
Step 7: Validate and Document
Reconcile dashboard figures with financial statements, document all assumptions and methods, maintain a monthly validation checklist, this protects audit readiness and team onboarding.
Formulas and Real World Examples
Core formulas, contribution per unit equals net selling price minus variable cost per unit, P/V ratio equals contribution divided by net sales, BEP in units equals fixed costs divided by contribution per unit, BEP in revenue equals fixed costs divided by P/V ratio, margin of safety equals actual sales minus BEP sales, margin of safety percentage equals (actual minus BEP) divided by actual multiplied by 100, for a quick refresher, browse how to calculate the break even point.
Scenario 1: D2C Fashion Brand
Monthly fixed costs ₹80,000, variable cost per unit ₹20, net selling price ₹50 after GST, contribution per unit ₹30, BEP units equals ₹80,000 divided by ₹30 equals 2,667 units, BEP revenue equals 2,667 multiplied by ₹50 equals ₹1,33,350, selling 3,500 units gives margin of safety of 833 units or 24 percent, comfortable, yet watch discounts and returns during sales periods.
Scenario 2: IT Service Firm
Monthly fixed costs ₹5,00,000, variable cost per billable hour ₹1,000, billing rate ₹3,000 per hour, contribution per hour ₹2,000, BEP hours equals ₹5,00,000 divided by ₹2,000 equals 250 hours, with 20 consultants at 160 billable hours each, you have 3,200 hours, margin of safety is 92 percent, excellent, but confirm rate realization and write offs.
Best Practices and Implementation Tips
- Compute contribution and BEP using net of GST figures, keep gross only for statutory reporting.
- Update fixed costs monthly, watch for creep in SaaS and retainers, remove unused tools promptly.
- Split semi variable costs, for example, utilities with baseline plus usage, accuracy improves noticeably.
- Use 3 to 6 month averages for seasonal businesses, Diwali sales can distort single month views.
- Run separate analyses by channel, marketplace fees and shipping routes differ meaningfully.
- Document classification logic, and review quarterly as models evolve.
For continued learning, pair break even point with break even analysis examples to benchmark your approach.
Common Pitfalls and Solutions
Misclassifying Salary Costs
Production salaries are often variable, admin salaries are fixed, separate by function and variability, do not lump them together.
Including GST in Contribution Calculations
Including GST inflates contribution and understates BEP, compute net of GST for internal profitability analysis.
Ignoring Discounts and Returns
Deep discounts reduce net price, returns increase effective variable costs, incorporate both in the variable cost dashboard.
Treating One Time CapEx as Fixed Costs
Depreciate capital expenses over useful life, do not insert full amounts into monthly fixed costs.
Missing Hidden Variable Costs
Stock write offs, damages in transit, payment failures, and packaging losses are real variable costs, include them in calculations to avoid margin surprises.
Review break even analysis and break even analysis examples to keep your checklist comprehensive.
How CA Firms Can Productize Break Even Services
Offer monthly packages for dashboard setup, commentary, and recommendations using contribution analysis tools, build industry specific templates for ecommerce, manufacturing, and services, configure margin of safety alerts, run quarterly scenario planning around GST changes or competitive pricing, bundle with cash flow forecasting and working capital optimization, then train client teams for sustained adoption.
Where AI Accountant Fits in Your Break Even Journey
AI Accountant accelerates ingestion from Zoho Books and Tally, learns classification patterns to automate fixed versus variable categorization, nets GST automatically, provides read only dashboards for secure stakeholder access, and offers multi org support for CA firms managing many clients, hours saved, clarity gained.
Implementation Checklist for Success
Week 1: Foundation
- Confirm net of GST calculations in revenue and variable costs
- Document fixed versus variable classification rules
- Identify semi variable costs and splitting logic
- Set up data sources and integration points
Week 2: Build
- Create contribution calculations by product and channel
- Validate calculations against historical data
- Design variable cost dashboard layout
- Configure fixed cost tracking mechanisms
Week 3: Enhance
- Set up margin of safety calculator with alerts
- Build contribution analysis tools with scenarios
- Create visualization templates
- Test alert thresholds
Week 4: Deploy
- Document all assumptions and methods
- Train team members on dashboard usage
- Schedule monthly review meetings
- Create feedback mechanisms for improvements
Ongoing: Maintain
- Monthly fixed cost updates
- Quarterly classification reviews
- Semi annual threshold adjustments
- Annual methodology assessment
Tools to Accelerate Your Break Even Analysis
- AI Accountant — Automates ingestion from Zoho Books and Tally, classifies fixed versus variable costs with AI, provides ready dashboards with automatic GST netting, ideal for Indian SMEs and CA firms.
- QuickBooks — Customizable reporting for break even analysis, manual classification usually required.
- Xero — Strong integrations and reporting, good for teams already in the ecosystem.
- FreshBooks — Simple interface with basic break even features, suitable for freelancers and small service firms.
- Tally Prime — Widely used in India, comprehensive reporting, BEP requires customization.
- Zoho Analytics — Connects with Zoho Books for advanced analytics and dashboards.
For conceptual grounding, pair the above with break even analysis and how to calculate the break even point when setting up formulas.
Taking Action Today
Start small with BEP and margin of safety tracking, connect Zoho Books or Tally to AI Accountant, let the platform learn your patterns while you focus on pricing, discounts, and channel mix. Set basic KPI tiles, then add contribution waterfalls, CVP charts, and alerts progressively. Schedule monthly reviews with your team or CA, perfect is the enemy of good, begin at 80 percent accuracy, then iterate.
For unit economics context, explore the unit economics calculator India, and anchor your pricing and contribution decisions to a consistent framework.
The Indian market rewards leaders who understand their numbers deeply, with a clear dashboard, you will make better pricing decisions, control costs, and sleep better knowing exactly where profitability begins.
FAQ
How should a CA compute BEP for multi rate GST scenarios without distorting contribution?
Compute revenue and variable costs net of GST per SKU or service, then aggregate, avoid mixing gross and net lines, AI Accountant auto nets GST from invoices and bills, ensuring contribution and P/V ratios reflect true economics.
What is the recommended margin of safety threshold for D2C brands in India during festival seasons?
Target at least 20 percent margin of safety before a sale period, if heavy discounts or returns are expected, raise the buffer to 25 to 30 percent, configure alerts when margin of safety drops below threshold so you can tweak price or reduce discount depth.
How can I reconcile my dashboard’s BEP with Tally trial balances monthly?
Align revenue and variable costs to net of GST in the dashboard, keep statutory reports as gross in Tally, run a reconciliation that maps invoice level data to contribution lines, then confirm fixed costs totals match the GL, AI Accountant can automate this mapping.
How do I classify semi variable expenses, for example utilities and phone bills, for accurate contribution?
Split into baseline fixed and usage based variable components, for instance, fixed rental ₹1,000 plus usage charges, set rules in AI Accountant to allocate the baseline to fixed and the remainder to variable, review quarterly as patterns change.
How should discounts, coupons, and marketplace commissions be treated in contribution calculations?
Reduce net selling price by discounts and coupons first, then subtract variable costs including marketplace commissions and gateway fees, this yields realistic contribution per unit, dashboards should show pre discount and post discount views to avoid confusion.
What PV ratio ranges indicate healthy contribution for consumer goods, and how should I act on changes?
Many consumer goods operate between 30 to 45 percent P/V ratio, if ratio drops due to price cuts or cost hikes, model price sensitivity with sliders, consider smaller discounts, better packaging rates, or renegotiate commissions, AI Accountant’s contribution tools make this fast.
Can service businesses use hours as units for BEP, how do we handle bench time?
Yes, use billable hours as units, allocate bench salaries to fixed costs, compute contribution per hour as billing rate minus variable project costs, manage utilization targets to keep margin of safety high, dashboards should show bench trends explicitly.
How frequently should an SME refresh the break even dashboard, and what cadence suits CA reviews?
Refresh weekly for high velocity D2C, monthly for most SMEs, during sale seasons consider daily updates, CAs can run monthly validation plus quarterly scenario planning sessions for decisions on pricing, inventory, and expansion.
How do I model returns, damages, and failed payments as variable costs without double counting?
Create separate variable cost lines for returns and failures, tie them to the originating SKU and channel, exclude GST components from these lines, ensure they reduce contribution appropriately, AI Accountant’s rule based classifications prevent double counting.
What is cash break even versus accounting break even, and when should clients track both?
Accounting break even includes non cash items like depreciation, cash break even excludes them and focuses on cash outflows, track accounting BEP monthly for profitability discipline, use cash BEP when planning liquidity and working capital.
Can AI Accountant auto ingest Zoho Books and Tally, then classify fixed versus variable reliably?
Yes, AI Accountant ingests and normalizes data from Zoho Books and Tally, learns your classification patterns, and continuously applies rules to new transactions, saving hours of manual effort while improving consistency and audit readiness.
How should a CA present BEP insights to founders, with quick actions and examples?
Lead with KPI tiles, margin of safety, and contribution waterfalls, then offer two or three actionable levers, for example, reduce shipping costs via zone optimization, trim low ROI subscriptions, and adjust discount ladders, share a one page summary from the AI Accountant dashboard for clarity.

Rohan Sinha is a fintech and growth leader building aiaccountant.com, focused on simplifying accounting and compliance for Indian businesses through automation. An IIT BHU alumnus, he brings hands-on experience across 0 to 1 product building, growth, and strategy in B2B SaaS and fintech.