Key takeaways
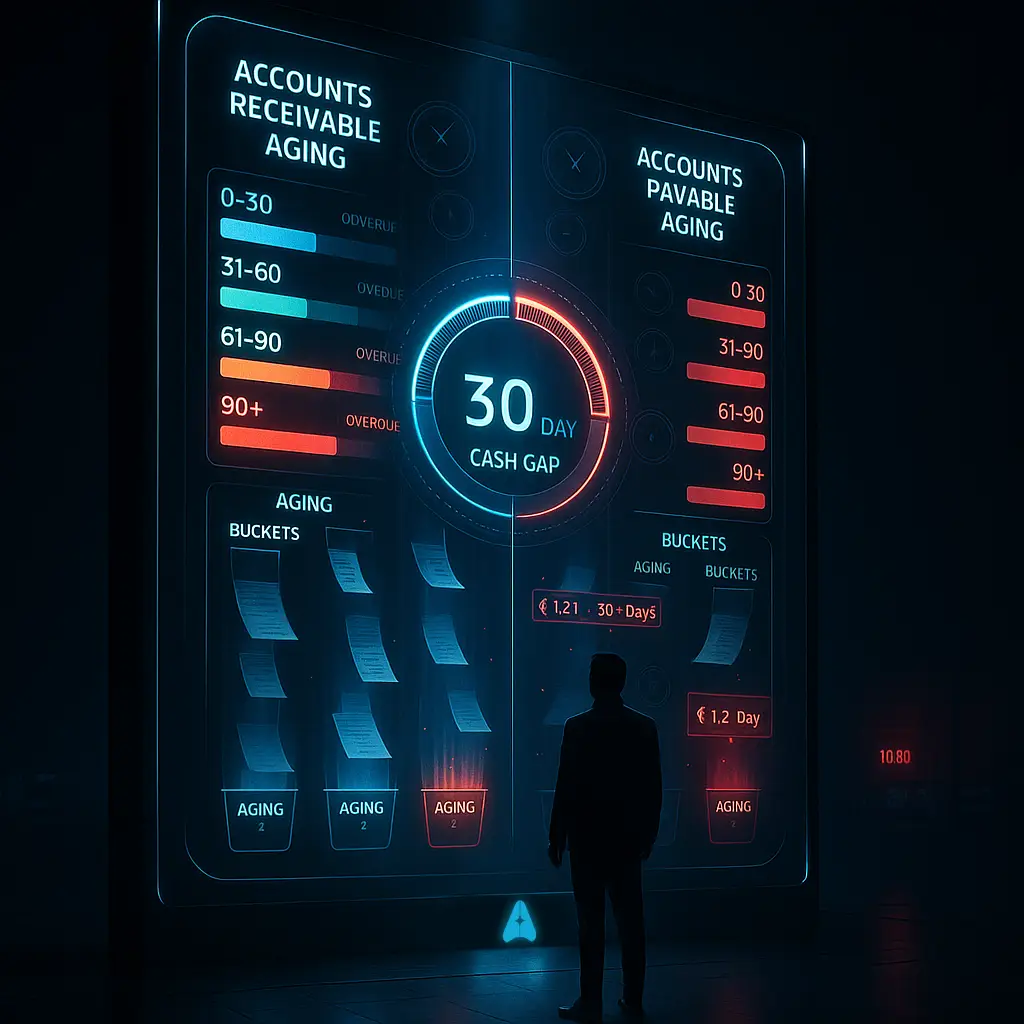
- AR/AP aging charts sort outstanding invoices and bills into time buckets (0–30, 31–60, 61–90, 90+ days) so you can spot cash flow gaps at a glance instead of digging through spreadsheets.
- DSO and DPO visualizations reveal your cash conversion cycle. A 30 day gap between collections and payments means you are funding that shortfall from your own pocket.
- Trend charts uncover seasonal patterns, such as rising 90+ day overdue receivables during monsoon slowdowns, giving you time to tighten credit terms before cash dries up.
- Automated alerts on aging thresholds eliminate the risk of invoices silently crossing 60 or 90 days without follow up, cutting average overdue amounts significantly.
- For CA firms managing dozens of clients, color coded dashboards with drill downs replace hours of manual Excel work during GST filing season.
- AI Accountant's bookkeeping automation ingests bank statements, matches them to invoices and bills, and generates real time aging visuals so you always know where your cash stands.
AR/AP Aging Visualization: What's New in 2026
Until March 2025, GST e-invoicing applied only to businesses with annual turnover above ₹5 crore. From April 2025, the threshold dropped to ₹1 crore, pulling a much larger pool of SMEs into mandatory e-invoicing under CBIC's notification framework. This shift has a direct impact on AR/AP aging workflows.
With more invoices flowing through the e-invoicing system, there is now a richer, machine readable data trail for every receivable and payable. CA firms that previously tracked aging in manual spreadsheets are finding it impractical to reconcile the higher invoice volumes without automation. The day to day change is real: every sales invoice now carries an IRN (Invoice Reference Number), and matching payments against IRN stamped invoices adds a new reconciliation step.
Who does this hit hardest? SMEs in the ₹1 crore to ₹5 crore turnover band, especially those on Tally who never needed e-invoicing before. These businesses now face blocked ITC claims if invoices are not properly matched and filed. The GST portal flags mismatches during GSTR-2B reconciliation, and unresolved mismatches attract interest at 18% per annum on delayed ITC.
What to do now:
- Verify that your aging reports pull IRN data alongside invoice dates and amounts.
- Run a reconciliation check between your GSTR-1 and GSTR-2B before each filing deadline.
- Set aging alerts at 30 and 60 days so overdue items surface before they become ITC reversal risks.
Firms using automated GST reconciliation can map e-invoice data to aging buckets without manual intervention, keeping both compliance and cash flow visibility in sync.
AR AP Aging Charts Overview
Managing cash flow can be like being a traffic controller for money in your business. Accounts receivable (AR) represents the money customers owe you. Accounts payable (AP) covers what you owe vendors. Aging charts organize these amounts into time buckets so you can see which invoices or bills need immediate attention.
Think of it as a health check for your working capital. Instead of scrolling through hundreds of ledger entries, you get a single visual that shows exactly where your money is stuck.
Modern accounting automation solutions provide these charts automatically, updating them in real time to reflect your business's current position.
Components of AR and AP Aging Charts
Most AR and AP aging charts use standardized intervals:
- Current (0–30 days) for invoices and bills within terms.
- 31–60 days past due indicating moderate delays.
- 61–90 days past due requiring immediate action.
- Over 90 days past due often forcing collections or write offs.
A receivables aging graph uses color coded bars to highlight overdue buckets. A payables aging dashboard breaks down amounts by vendor. These visuals make it easy to spot chronic late payers or vendors awaiting payment.
Many CA firms also add a "disputed" or "on hold" category to separate genuine delays from invoices stuck in approval cycles. This keeps your aging report clean and actionable.
Why AR and AP Aging Visualization Matters
Manual spreadsheets rarely deliver real time insights. Visual tools let chartered accountants and business owners grasp their cash position in minutes. You can detect payment delays, spot cash flow bottlenecks, and optimize credit control or payment terms with vendors.
"Without automated aging charts, you might spend hours updating cells only to realize the data is outdated."
By automating this process, you free up time for strategic advisory work and stronger relationship management. According to ICAI's practice guidelines, proactive receivables monitoring is a core part of sound financial management for small and medium enterprises.
Visualizing Overdue Trends with Graphs
An overdue trends chart tracks how receivables and payables move across aging buckets over time. For example, if your 90+ day receivables climb from ₹50,000 in January to ₹1.2 lakh in March, a trend chart highlights the escalation clearly. This prompts timely action before the amount becomes uncollectible.
Trend visuals also uncover seasonality. Construction firms often see slowdowns during monsoon months. Retail businesses face longer collection cycles after festival credit sales. Spotting these patterns lets you adjust credit policies or require deposits proactively.
A well designed overdue receivables trend graph can also serve as evidence during board reviews or lender discussions, showing that your collections process is disciplined and data driven.
DSO and DPO Visualization
Days Sales Outstanding (DSO) measures the average days to collect customer payments. Days Payable Outstanding (DPO) measures how long you take to pay vendors. A combined DSO and DPO visualization reveals your cash conversion cycle and any gaps.
If DSO is 45 days and DPO is 15 days, you have a 30 day cash gap. That means you are paying suppliers a full month before customers pay you. Visual dashboards make this gap impossible to ignore and prompt you to improve collections or negotiate longer payment terms.
The Reserve Bank of India has noted that working capital mismanagement is among the top reasons MSME loan accounts turn stressed. Tracking DSO and DPO visually is one of the simplest ways to prevent that slide.
How AI Accountant Generates Aging Visuals
AI Accountant automatically processes bank statements, matches transactions to invoices and bills, and updates aging charts in real time. Key features include:
- Vendor wise and customer wise aging breakdowns with drill down details.
- Automated alerts when amounts hit critical aging thresholds.
- Paid vs outstanding graphs showing aging bucket proportions over time.
- Transaction matching that links bank credits and debits to specific invoices, reducing manual reconciliation effort.
With these capabilities, you always have up to date, actionable insights without manual spreadsheet maintenance. The platform integrates with Tally, so your existing ledger data flows in without re-entry.
Real World Use Cases
CA Firm During GST Season: Rajesh uses payables dashboards to avoid service disruptions by spotting delayed payments to a GST software vendor. He catches a ₹40,000 invoice sitting in the 61–90 day bucket and clears it before the vendor suspends access during filing week.
Manufacturing Founder: Sunita spots a distributor exceeding 60 day overdue receivables and negotiates a payment plan based on insights from her aging graph. She also sets a 45 day alert for that customer going forward.
Textile Exporter: Arjun prioritizes rupee payments during exchange rate volatility by viewing domestic and USD denominated payables side by side. This helps him time vendor payments to minimize forex loss, a common challenge for exporters tracked under RBI's FEMA guidelines.
Restaurant Chain CFO: Meera's DSO and DPO chart reveals slower platform settlements from food delivery aggregators. She uses the data to renegotiate for faster remittances, improving her cash cycle by nearly a week.
FAQ
How can I integrate AR AP aging charts into my existing accounting workflow?
You can use automation tools that import transactions, match invoices and bills, and generate real time aging visuals. This integration eliminates manual data entry and ensures your aging charts always reflect the latest information from your Tally or accounting system.
What are the best aging buckets to use for Indian SMBs?
Standard buckets are 0–30, 31–60, 61–90, and over 90 days. These intervals align with typical credit terms in India and help you identify moderate and critical overdue amounts quickly. If your business has shorter payment cycles (such as retail), you can create custom intervals like 0–15 and 16–45 days.
How does trend visualization help with seasonal cash flow fluctuations?
Trend charts plot aging data over multiple periods to reveal patterns like slow payments during monsoon or festival seasons. This insight lets you tighten credit policies, require upfront deposits, or build a cash buffer before predictable slow periods hit.
Can AI Accountant alert me about overdue invoices automatically?
Yes, AI Accountant sends automated alerts when invoices or bills cross predefined aging thresholds such as 30, 60, or 90 days. You get notified as soon as an invoice enters a critical bucket, enabling timely follow up before the amount becomes hard to collect.
How do I interpret a DSO and DPO chart to improve my working capital?
A DSO and DPO chart shows the gap between how fast you collect from customers and how quickly you pay suppliers. If DPO exceeds DSO, you have a positive cash float, meaning vendor credit effectively funds your operations. If DSO exceeds DPO, you need to either speed up collections or extend payment terms with vendors.
How do aging charts support GST compliance?
Aging dashboards highlight overdue vendor payments that may affect your input tax credit claims. Under current GST rules, ITC on invoices older than 180 days without payment must be reversed (2026 update). Keeping aging charts current ensures you do not miss reversal deadlines or attract interest penalties.
What data does AI Accountant use to create AR AP aging charts?
It processes bank statements, invoice data from your accounting system (including Tally), and supplier bills. The tool matches payments to invoices and categorizes outstanding amounts into aging buckets automatically, giving you a consolidated view without switching between multiple reports.

Rohan Sinha is a fintech and growth leader building aiaccountant.com, focused on simplifying accounting and compliance for Indian businesses through automation. An IIT BHU alumnus, he brings hands-on experience across 0 to 1 product building, growth, and strategy in B2B SaaS and fintech.